-
- Mod 3 - Multiple Reg
- 3.1 Overview
- 3.2 The Model
- 3.3 Assumptions
- 3.4 Modelling LSYPE Data
- 3.5 Model 1: Ordinal Explanatory Variables
- 3.6 Model 2: Dichotomous Explanatory Variables
- 3.7 Model 3: Nominal Variables
- 3.8 Predicting Scores
- 3.9 Model 4: Refining the Model
- 3.10 Comparing Coefficients
- 3.11 Model 5: Interaction Effects 1
- 3.12 Model 6: Interaction Effects 2
- 3.13 Model 7: Value Added Model
- 3.14 Diagnostics and Assumptions
- 3.15 Reporting Results
- Quiz
- Exercise
- Mod 3 - Multiple Reg
Using Statistical Regression Methods in Education Research

3.4 Using SPSS to Model the LSYPE Data
|
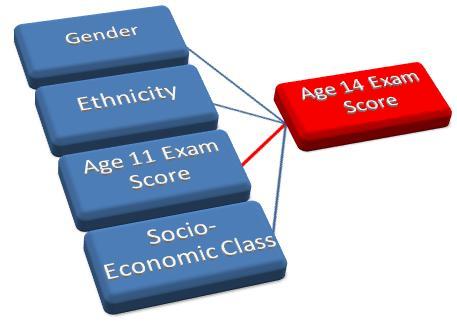
In our example of simple linear regression in the previous module we found that prior academic achievement (age 11) is a good predictor of future academic achievement (age 14). This seems reasonable but surely there is more to it than that! The socio-economic class (SEC) of the parents is known to be related to students’ academic achievement. The media talk about a gender gap in exam scores and inequalities between different ethnic groups. If we knew about these other variables could we improve the predictive power of our model? Multiple linear regression provides us with the tools we need to explore these questions! Figure 3.4.1: Factors which may influence Age 14 exam score The rest of this module is largely dedicated to an example which will build these variables into our multiple regression model and improve our understanding of the relationship between these factors and educational achievement. Over the next few pages we will be building up a model for predicting achievement during age 14 (KS3) exams. There will be seven different versions of the model as we build up your knowledge and refine the structure of our regression model with each new variable. We will show you how to run this process on SPSS. Why not follow us through using the LSYPE MLR 15,000 Though it is not advisable to use anything other than a continuous variable for an outcome variable in multiple linear regression it is possible to use ordinal and nominal variables as explanatory variables. Before we can do this the data needs to be set up in a specific way on SPSS. The ordinal and nominal variables must be coded as numbers so that SPSS can understand them.
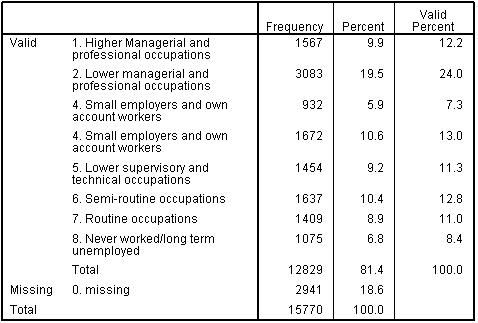
The process for ordinal variables is straight forward as it simply means ranking the categories. For example, for socio-economic class (SEC) data provided by parents on their occupation and employer have been coded using the Office for National Statistics socio-economic classification (for further details on this coding system see our Resources While SEC is usually treated as an ordinal rather than a continuous variable, for the purpose of this example we will initially treat SEC as if it were a scale. However, ordinal variables should only be used in this way when there are at least five categories (levels) within the variable, a reasonable spread of cases across the levels, and a roughly linear relationship with the outcome. All these conditions are met for SEC (see Figure 3.4.2 and later Figure 3.5.2). Regression is a very ‘robust’ procedure when it comes to treating ordinal variables as continuous predictors so given these conditions are met this is permissible, although we will discuss some limitation to treating ordinal variables in this way later in the analysis. Figure 3.4.2: Frequency table for SEC of the home
Simple dichotomies Some nominal variables are simple dichotomies which mean they have only two mutually exclusive categories (e.g. you are either eligible for a free school meal or you are not – you can only belong to one of two categories). These are called dichotomous or binary variables because they have only two categories. Adding such variables to your regression module is fairly simple because we can simply give each category a numeric code (e.g. for gender code males as '0' and females as '1'). The output will represent a direct comparison between the two categories – this will become clearer when we run our example!
Multiple categories When you have nominal variables with multiple categories that cannot be ranked it requires a slightly more complicated approach. How do you numerically code a variable like school type? We can assign numbers to different school types, e.g. 0 for 'community schools', 1 for 'independent schools', 2 for 'foundation schools' 3, for 'voluntary-aided schools' and so on. However these numbers do not represent more or less of something as they do with SEC. In this case it is necessary to set up a number of comparisons such that a reference category (say 'community schools') is compared to each of the other categories. This means you have to create a series of new binary variables (for example 'independent school’, 'foundation school’ and ‘Voluntary-aided school’) where each case is coded '1' if it is from that particular school type and coded ‘0’ otherwise. This procedure is often called setting up dummy variables. There should be one less dummy variable than the number of categories in the variable. So if we had four types of school we would need to choose one to be our base or reference category (e.g. community schools) and then create three dummy variables to compare each of the remaining categories (independent, foundation and voluntary-aided) to this reference category. This is easiest to understand with examples. Over the next few pages we will introduce a variable of each of these types into our model.
|
 dataset? The variables are already there for you so you will be able to run the analyses without creating the new variables (you’ll see what we mean by this when we get started). Come on, it will be fun. Like a convoy.