-
- Mod 3 - Multiple Reg
- 3.1 Overview
- 3.2 The Model
- 3.3 Assumptions
- 3.4 Modelling LSYPE Data
- 3.5 Model 1: Ordinal Explanatory Variables
- 3.6 Model 2: Dichotomous Explanatory Variables
- 3.7 Model 3: Nominal Variables
- 3.8 Predicting Scores
- 3.9 Model 4: Refining the Model
- 3.10 Comparing Coefficients
- 3.11 Model 5: Interaction Effects 1
- 3.12 Model 6: Interaction Effects 2
- 3.13 Model 7: Value Added Model
- 3.14 Diagnostics and Assumptions
- 3.15 Reporting Results
- Quiz
- Exercise
- Mod 3 - Multiple Reg
Using Statistical Regression Methods in Education Research

3.10 Comparing Coefficients Across Models
|
A significant objective in multiple regression modelling, as we observed in the introduction, is to assess the association of a variable with an outcome after controlling for the influence of other variables. Figure 3.10.1 shows the relationship between ethnicity and SEC and it is apparent that students from minority ethnic backgrounds are less likely to be from the more affluent socio-economic classes than those from a White British background. Regression can be used to ascertain whether the ethnic gaps in attainment at age 14 result from these observed differences in SEC between ethnic groups. We can undertake this analysis by comparing the coefficients for our variable of interest (ethnic group) both before and after including the other ‘control’ variables in the multiple regression model (SEC and gender). Figure 3.10.1: % SEC breakdown by Ethnic group
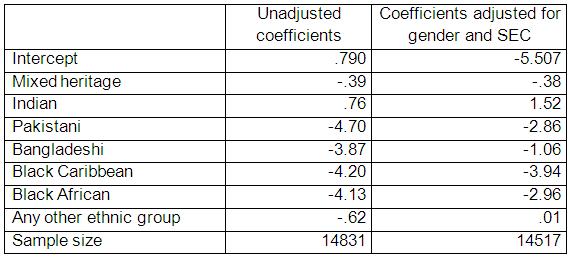
Table 3.10.2: Regression coefficients for ethic groups before and after controlling for gender and SEC of the home
Note: The sample size reduction in the adjusted model reflects the exclusion of 314 cases where gender was not known.
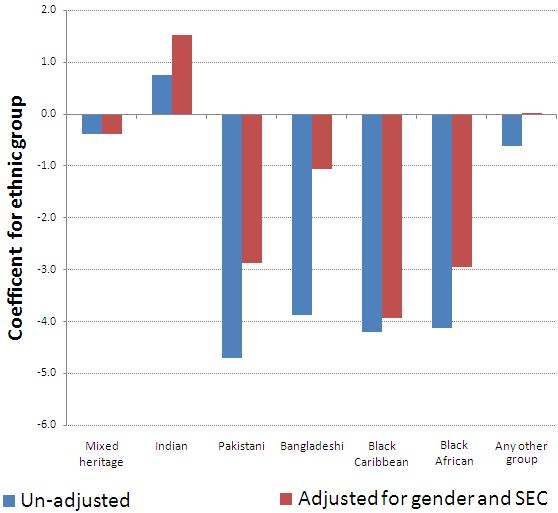
Figure 3.10.3: Relationship between ethnic group and age 14 standard score before and after controlling for gender and SEC of the home
There are many other variables in our LSYPE dataset than just SEC, gender and ethnicity, and it is likely that some of these may explain more of the ethnic gaps in attainment. However at this stage it is sufficient to show how coefficients can be compared across regression models to demonstrate the principle involved. One of the strengths of multiple regression is being able to ascertain the relative importance of a explanatory variable once others have been taken into account. |
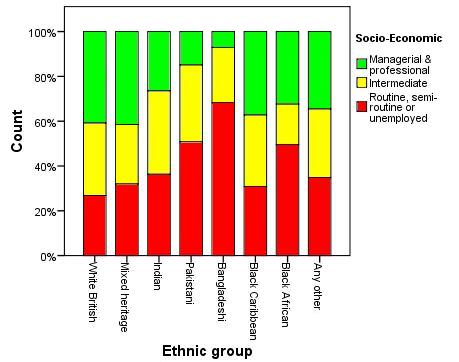 Figure 3.10.3 shows the relationship between ethnic group and age 14 standard score both before and after controlling for the influence of gender and the SEC of the home. In both cases the reference category is White British students. The blue bars represent the unadjusted difference in mean age 14 scores between ethnic groups (the values for coefficients e1 to e7 when these are the only