Using Statistical Regression Methods in Education Research

1.2 Population and Sampling
|
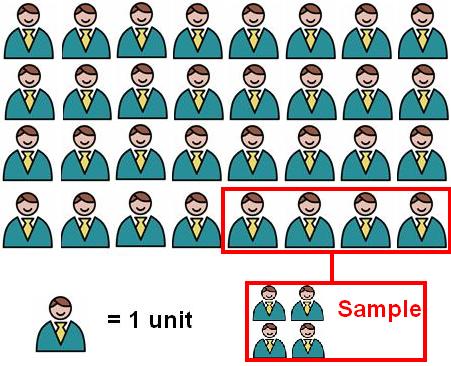
The word ‘population’ is in everyday use and we usually use it to refer to a large group of people. For example, the population of a country or city is usually thousands or millions of individuals. In social research the term can have a slightly different meaning. A population refers to any group that we wish to generalise our research findings to. Individual cases from a population are known as units. For example, we may want to generalise to the whole population of 11-12 year old students in the UK in order to research a particular policy aimed at this group. In this case our population is all British 11-12 year olds, with every child being a single unit. Alternatively we may be performing a piece of research where the sole objective is to improve the behaviour of a certain year group (say year 7) in a specific school (Nawty Hill School). In this case our population is year 7 of Nawty Hill School. Our research is usually intended to say something about the particular population we’re looking at. In both of the above examples the populations were made up of individual people as units but this is not necessarily always the case – it depends on how we frame our research question. It may be that we want to compare behaviour at all secondary schools in the South of England (the infamous Nawty Hill Secondary does not come out of this analysis looking good!). In this case each individual school is a unit with every school in the South of England making up the population. In an ideal world we would be able to gather data about every unit in our population but this is usually impractical because of issues of costs in terms of money, time and resources. Returning to an earlier example, what if we wanted to gather achievement data about every 11-12 year old student in the UK? Unless you have a truly enormous budget (sadly unlikely in these credit-crunched times) and plenty of research assistants you will not be able to interview or get a questionnaire back from all of these students. However it is not necessary to gather data on every member of a population in order to say something meaningful, you could draw a sample from the population. Figure 1.2.1 shows the relationship between samples and populations. A group of individuals (units) is selected from the entire population to represent them. If the sample is drawn well (more on this later) then it should accurately reflect the characteristics of the entire population... it is certainly more efficient and cost effective than contacting everyone! Figure 1.2.1: Sampling a population
Note that, despite what this image may suggest, most populations are not consisted entirely of featureless male office workers. Selecting a suitable sample is more problematic than it sounds:
Would the data you gained from these groups be a fair representation of the population as a whole? We’ll discuss this further in the next section. Below is a summary of what we have covered so far:
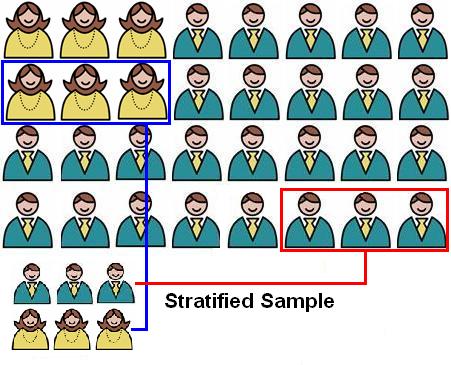
Selecting a representative sample for your research is essential for using statistics and drawing valid conclusions. We are usually carrying out quantitative research because we want to get an overall picture of a population rather than a detailed and contextualised exploration of each individual unit (qualitative approaches are usually better if this is our aim). However, a population is a collection of unique units and therefore collecting a sample is fraught with risk – what if we accidentally sample only a small subgroup that has differing characteristics to the rest of the population? For example, imagine we were trying to explore reading skill development in 6 year olds. We have personal connections with two schools so we decide to sample them. One is based in the centre of a bustling metropolis and the other is based on a small island which has no electricity and a large population of goats. Both of these samples are six year old students but they are likely to differ! This is an extreme example but we do have to be careful with such ‘convenience’ sampling as it can lead to systematic errors in how we represent our target population. The best way to generate a sample that is representative of the population as a whole is to do it randomly. This ‘probability sampling’ removes bias from the sampling process because every unit in the population has an equal chance of being selected for the sample. Assuming you collect data about enough participants you are likely to create a sample that represents all subgroups within your population. For example, returning to Nawty Hill Secondary School, it is unlikely that all of the 2000 students who attend regularly misbehave. A small proportion of the students (let’s say 5%) are actually little angels and never cause any trouble for the poor harassed teachers. If we were sampling the school and only chose one student at random there would be a 1 in 20 change of picking out one of these well-behaved students. This means that if we only took a sample of only 10 there would be a chance we wouldn’t get one well-behaved student at all! If we picked 100 students randomly we would be likely to get five well-behaved students and this would be a balanced picture of the population as a whole. It is important to realise that drawing samples that are large enough to have a good chance of representing the population is crucial. We’ll talk about sample size and probabilities a lot on this website so it is worth thinking about! There are also more sophisticated types of sampling: Stratified sampling: This can come in handy if you want to ensure your sample is representative of particular sub-groups in the population or if you are looking to analyse differences between subgroups. In stratified sampling the researcher identifies the subgroups that they are interested in (called strata) and then randomly samples units from within each strata. The number of cases selected from each strata may be in proportion to the size of the strata in the population or it may be larger depending on the purpose of the research. This can be very useful if you want to examine subgroups of units which are not well represented in the overall population. For example, 5% of students in England identify themselves in ‘Black’ ethnic groups, but a random sample, unless it is very large, may well not include 5% of Black students. A stratified sample might be drawn to ensure that 5% of the sample are from Black ethnic groups. Alternatively a ‘boosted’ sample might target some groups to ensure enough individuals are selected to form a good basis of comparison. Figure 1.2.2 illustrates a stratified sampling strategy including a boosted sample for females who are under-represented relative to males in the population (this is not uncommon when looking at course enrolment for degrees in science, technology, engineering and mathematics, for example). Figure 1.2.2: A stratified sample
Note that, despite what this image may suggest, most females are not featureless and do not have beards. For example, if you wanted to compare the well-behaved and poorly behaved students at Nawty Hill School and you randomly selected 100 students from the whole population you might get less than 5 well behaved students, but if you stratify by behaviour and select within strata you can guarantee that you will get 5 well behaved students. Indeed you could over select from within the poorly behaved stratum to select a sample of 25 well-behaved and 75 poorly-behaved students so you had large enough samples to make reliable comparisons. It is important though that sampling within the subgroups should still be random where at all possible. Cluster sampling: When the population is very large (e.g. a whole country) it is sometimes viable to divide it into smaller groups called clusters. First, several of these clusters are randomly selected for analysis. After this individual units from within each selected cluster are randomly selected to make up the sample. For example if we wanted to sample all students in the UK it might be worth first dividing the population into geographic clusters (e.g. South-east, North-west). We would then randomly decide which of these regions we would draw our sample from and this would give us smaller groups to work with (much more practical). For cluster sampling to be viable there should be minimal differences between clusters - any substantial differences must be within them. We’ve discussed sampling in some depth now. In summary:
|