|
|
| 1. If you wanted to find out about the career destinations of graduates in England it would be very hard to speak to ALL of the population – you would need to take a sample and speak with that smaller group. Please indicate which of the following statements are true (there may be more than one!).

|
|
|
2. Take a look at the following graphs (A-D):
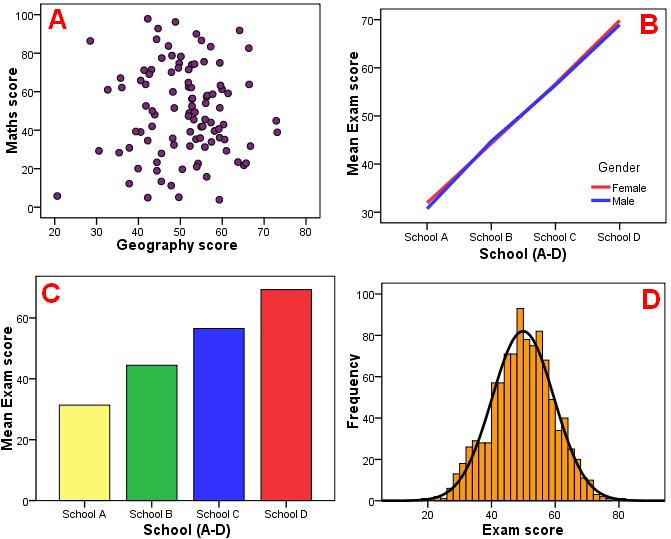
Please match the graph type to the relevant graph letter.
|
|
| 3. Please match up the descriptions with each type of data.
|
|
|
|
|
|
|
|
|
| 5. The mode of a dataset is the value that occurs most frequently. |
|
|
|
|
| 6. What does the standard deviation represent? |
|
|
|
|
| 7. What is the difference between the standard deviation and the variance? |
|
|
|
|
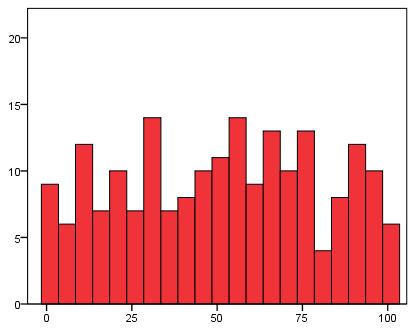
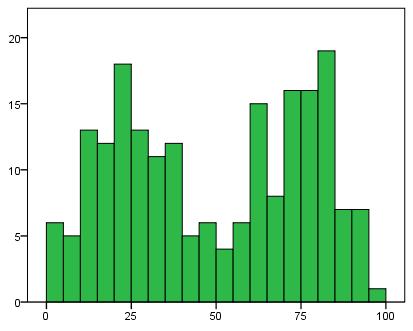
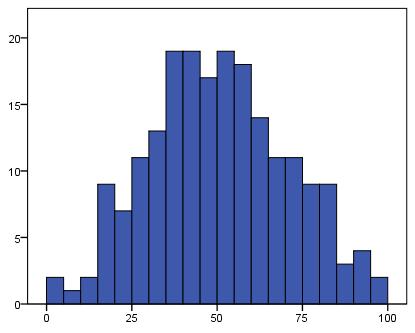
| 8. The following histograms represent scores on three different exams. Match the graph to the type of distribution that it most likely represents by dragging and dropping the answers below.
|
|
9. The table below shows some summary statistics about how many evenings a week participants did homework. Please indicate which of the following statements are true (you can pick more than one). |
|
|
|
|
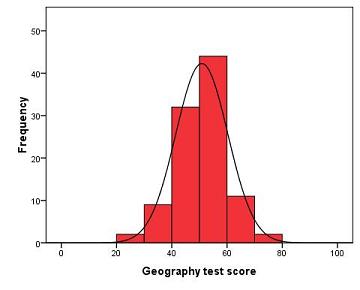
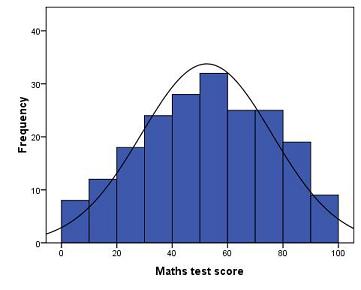
10. The histograms of exam results in Geography (A) and Maths (B) represent data from samples of the same size (200 students in each class). The increments along the X axis (exam score %) and the Y (frequency) axis are equal. Please drag each of the statements into the ‘true’ or ‘false’ category.
Histogram A
Histogram B
|
|
| 11. Which of the statements best describes what the standard error of the mean represents? |
|
|
| 12. A researcher is exploring annual truancy rates across a sample of schools in England. She calculates that the mean percentage of students who play truant at least once a year is 27%, but this varies considerably from school to school. She calculates a 95% confidence interval (CI) for this mean of 7% – 47%. What does this CI indicate? |
|
|
13. The graph below shows error bars:
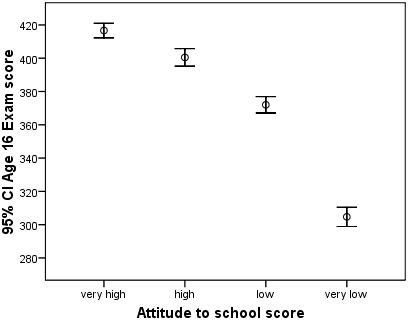
What does the range encompassed by each error bar represent? |
|
|
| 14. A statistical hypothesis test generally involves finding out whether an observed effect is unlikely to have occurred by chance. |
|
|
| 15. A researcher carries out an independent t-test to compare the scores on a reading test between two classes. Class A is shown to have a higher mean score than Class B and p < .05. What does this mean? |
|
|
| 16. Drag the correct definitions into the box for each type of error.
|
|
17. Take a look at the following pairs of normal curves. Imagine that they represent scores on a reading comprehension test with the blue curve representing a sample of seven year olds and the red curve a sample of eight year olds (with the group means represented by the black vertical lines). If you were to perform an independent samples t-test on this data which of the two datasets (A or B) do you think would be most likely to indicate a statistically significant difference?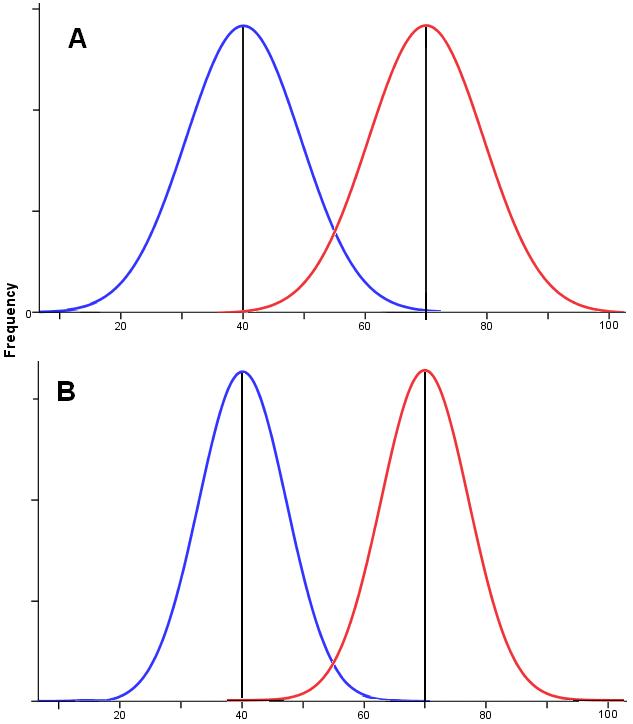 |
|
|
| 18. Two classes each of 20 students and of similiar ability are due to take a French quiz. Class A are given text books to study from while Class B are given access to computers and interactive software. Class B outperforms Class A (Cohen’s d = 0.65) but the difference is not statistically significant p = .11. What would be the most appropriate conclusion? |
|
|
19. A one-way ANOVA was performed to see if groups with differing attitudes towards school (very high, high, low or very low) had differing exam results at age 16. The following results were obtained:
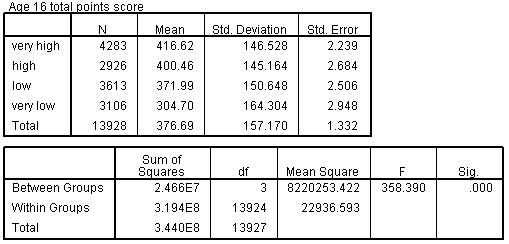
Please tick the box for each true statement. |
|
|
| 20. Post-hoc tests such as the scheffe test are… |
|
|
| Privacy statement |
| This quiz is anonymous. No data which personally identifies you is collected on the quiz, and the data you provide is used solely to help us improve the delivery of our courses. |
|
Your total score is :0 / 20
|
|