1.1 Overview: For Those of You New to Statistics...
|
If you’re new to this site you will probably fall in to one of two categories: Category A: You are fairly enthusiastic about learning quantitative
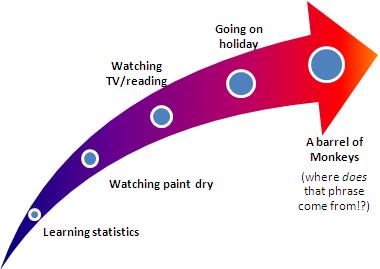
research skills and are eager to get stuck in to some data. You may already have some experience with statistics and may even be able to skip this module altogether and get started on one of the Regression Modules Category B: You are experiencing a powerful and compelling dread. You have never studied statistics and you did not get involved with social research to get bogged down in all of these meaningless numbers and formulae. Despite this, you feel you need to understand at least some statistics in order to become a more competent researcher. If you’re in category B we’re not going to lie to you. Learning to understand and use statistics might not be much fun. Here is the ‘Fun Scale’ (Figure 1.1.1) which was absolutely not based on real world research by a team of highly skilled and experienced academics. Please note the position of ‘Learning statistics’: Figure 1.1.1: The Fun Scale
As you can see, poor old statistics does not fare well... It can be challenging and boring when you first encounter it. But we’re not trying to scare you off – far from it! We’re trying to put some fight in to you. Statistics can become a very useful tool in your studies and career and we are living proof that, with the application of a bit of hard work, you can learn statistical skills even if you are not particularly maths orientated. The truth is that, once over the first few hurdles, most people find that stats becomes much easier and, dare we say it... quite enjoyable! We hope that the category B’s among you will stick with us.
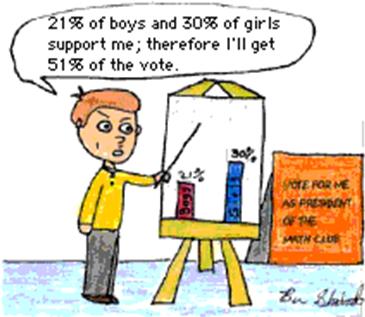
We live in a world in which statistics are everywhere. The media frequently report statistics to support their points of view about everything from current affairs to romantic relationships. Political parties use statistics to support their agendas and try to convince you to vote for them. Marketing uses statistics to target consumers and make us buy things that we probably don’t need (will that sandwich toaster really improve my life?). The danger is that we look at these numbers and mistake them for irrefutable evidence of what we are being told. In fact the way statistics are collected and reported is crucial and the figures can be manipulated to fit the argument. You may have heard this famous quote before: “There are three kinds of lies: lies, damned lies, and statistics.” Mark Twain. We need to understand statistics in order to be able to put them in their place. Statistics can be naturally confusing and we need to make sure that we don’t fall for cheap tricks like the one illustrated below (Figure 1.1.2). Of course not all statistics are misleading. Statistics can provide a powerful way of illustrating a point or describing a situation. We only point out these examples to illustrate one key thing: statistics are as open to interpretation as words. Figure 1.1.2: The importance of mistrusting stats
Understanding the prevalence of statistics in our society is important but you are probably here because you are studying research methods for education (or perhaps the social sciences more broadly). Picking up the basics will really help you to comprehend the academic books and papers that you will read as part of your work. Crucially, it will allow you to approach such literature critically and to appreciate the strengths and weaknesses of a particular methodology or the validity of a conclusion. Perhaps more exciting is that getting your head around statistics will unlock a vast tool box of new techniques which you can apply to your own research. Most research questions are not best served by a purely qualitative approach, especially if you wish to generalise a theory to a large group of individuals. Even if you don’t ever perform any purely quantitative research you can use statistical techniques to compliment a variety of research methods. It is about selecting the correct methods for your question and that requires a broad range of skills.
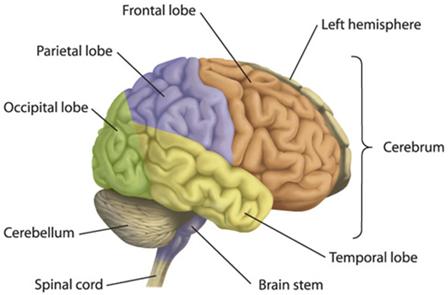
We won’t get in to the fine details yet but basically SPSS (sometimes called IBM SPSS or PASW) is computer software designed specifically for the purpose of data management and quantitative analysis in the social sciences. It is popular at universities all over the world and, though not perfect, it is a wonderful tool for education research. As we shall see it allows you to perform a dazzling array of analyses on data sets of any size and it does most of the heavy lifting for you... You won’t need to perform mind-numbing calculations or commit terrifyingly complex formulae to memory. Sounds great doesn’t it!? It is great. BUT you have to know what you’re doing to use it well. It has an unsettling tendency to spew tables of statistics and strange looking graphs at you and you need to learn to identify what is important and what is not so important. You also need to know how to manipulate the data itself and ask SPSS the right questions. In other words the most important component of the data analysis is ALWAYS you! Figure 1.1.3: Engage Brain Before Touching Keyboard!
Statistical techniques and SPSS are tools for analysing good data based on good research. Even if you’re an expert statistician who performs a flawless analysis on a dataset your findings will be pointless if the dataset itself is not good and your research questions have not been carefully thought out. Don’t get lost in the methods. Remember you are a researcher first and foremost! Now that we’ve set the scene and tried our best to convince you that learning statistics is a worthwhile endeavour let’s get started by looking at some of the basic principles that you will need. We are not aiming to provide a full and thorough introduction to statistics (there are plenty of materials available for this, just check out our Resources page |


