-
- Mod 5 - Ord Reg
-
5.1 Introduction
- 5.2 Ordinal Outcomes
- 5.3 Assumptions
- 5.4 Example 1 - Ordinal Regression on SPSS
- 5.5 Teacher Expectations and Tiering
- 5.6 Example 2 - Ordinal Regression for Tiering
- 5.7 Example 3 - Interaction Effects
- 5.8 Example 4 - Including Prior Attainment
- 5.9 Proportional Odds Assumption
- 5.10 Reporting the Results
- 5.11 Conclusions
- 5.12 Other Categorical Models
- Quiz
- Exercise
- References
-
- Mod 5 - Ord Reg
Using Statistical Regression Methods in Education Research

5.1 Introduction
|
In previous modules we have seen how we can use linear regression to model a continuous outcome measure (like age 14 test score), and also logistic
regression to model a binary outcome (like achieving 5+ GCSE A*-C passes). However you will remember
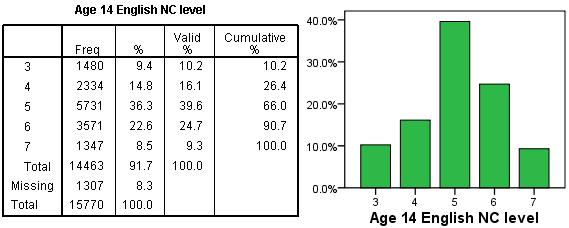
from the Foundation Module There are a number of ordinal outcomes in our LSYPE dataset. One is the KS3 (age 14) English test level. In England students’ performance is recorded in terms of national curriculum (NC) levels. These levels are reported on an age related scale, with the ‘typical’ student at age 7 expected to achieve level 2, at age 9 level 3, at age 11 level 4, and at age 14 somewhere between level 5 and level 6. These levels may be determined through teacher assessment or be expressed as summaries from continuous test marks. Figure 5.1.1 shows the distribution of students by English level from our dataset. Figure 5.1.1 Proportion of students at each English test level We do have access to the actual test marks in LSYPE, but often test marks are not available and NC levels might be the only data recorded. In any event, this is a good example of an ordinal outcome which we can work with to demonstrate the particular analyses that you can apply when your outcome measure is ordinal.
The good news is that, bar a little extra work, the assumptions and concepts we need for ordinal regression have been dealt with in the Logistic Regression Module |