-
- Mod 5 - Ord Reg
- 5.1 Introduction
- 5.2 Ordinal Outcomes
- 5.3 Assumptions
- 5.4 Example 1 - Ordinal Regression on SPSS
- 5.5 Teacher Expectations and Tiering
- 5.6 Example 2 - Ordinal Regression for Tiering
- 5.7 Example 3 - Interaction Effects
- 5.8 Example 4 - Including Prior Attainment
- 5.9 Proportional Odds Assumption
- 5.10 Reporting the Results
- 5.11 Conclusions
- 5.12 Other Categorical Models
- Quiz
- Exercise
- References
- Mod 5 - Ord Reg
Using Statistical Regression Methods in Education Research

5.9 What to do if the Assumption of Proportional Odds is not met
|
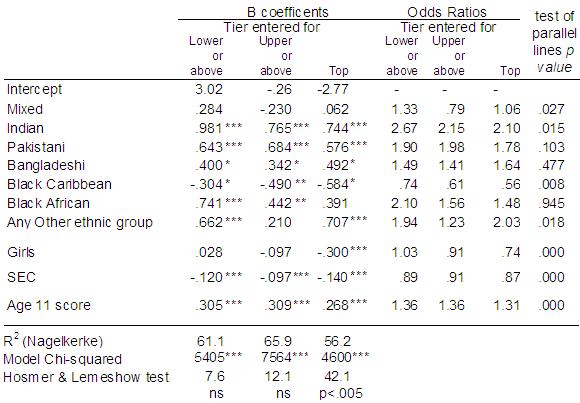
As we said earlier (on Page 5.4 In Figure 5.9.1 below we have dichotomised the ordinal tier variable at three cut-off points: top tier, upper tier or above, and lower tier or above (there is no need for a model for bottom tier or above since this includes all students). You can find these three variables in the dataset called TierTop, TierUpper and TierLower respectively. We have then completed three separate binary logistic regression models (see Module 4 Figure 5.9.1: Results of three binary logistic regressions for entry to top tier, upper tier or above and lower tier or above
We can now examine the ORs for each explanatory variable across the separate splits in the data to determine how consistent they are. As an additional check on the proportional odds assumption, the test of parallel lines was completed for each explanatory variable separately, that is separate ordinal models were completed each containing only a single explanatory variable. For ethnic group this was done using the dummy variables e1 (mixed heritage) to e7 (Any Other group), entering each in a separate model. Because of the large sample size a p<.01 level was used to guide decisions regarding non-proportionality. The p values are presented in the final column of Figure 5.9.1. The PO assumption appears to be rejected for both Sec2 and KS2stand using the separate tests of parallel lines (p<.000), but as explained earlier these are continuous variables and are likely to result in a high proportion of empty cells. Looking at the separate ORs across the three splits the difference in ORs appears negligible (.87 to .91 for Sec2, and 1.31 to 1.36 for ks2stand), so a common OR for each of these variables is a very plausible assumption. In relation to ethnic group, the PO assumption is upheld (p>.01) for all ethnic groups except for Black Caribbean. Looking across the separate ORs this seems plausible. While the ORs for Indian and Black African students are particularly high for the lower tier or above relative to the other two splits, the coefficients are all in the same direction. For Black Caribbean students the p value (p<.008) is just below our selected critical level p<.01. The cumulative OR of 0.66 does slightly underestimate the under-representation of Black Caribbean students in the top tier (0.56), and slightly overestimate their under-representation in the lower tier or above (0.74). However the coefficient for Black Caribbean students is broadly consistent in direction and magnitude across all the splits in the data. Black Caribbean students are the only ethnic group that is under-represented relative to White British students, the result is statistically significant at all splits, with broadly similar ORs which average close to the ordinal OR (.74+.61+.56) / 3 = 0.64. The OR for Black Caribbean students from the ordinal PO model therefore represents a reasonable summary of the overall pattern for Black Caribbean students. Importantly this under-representation persists after we control for prior attainment and for social class and so cannot be accounted for by these factors. The variable most out of line with the PO assumption is gender. The PO assumption is strongly rejected for this variable (p<.000). In the ordinal PO model the OR for boys was 1.11, which is the same as an OR for girls of (1/1.11) = 0.90. This suggests girls are under-represented relative to boys in entry to higher tiers. However this over-simplifies the data which shows girls are significantly under-represented in the top tier (0.74) but not significantly so for upper or above (.91) or for lower or above (1.03). This finding was obscured in the single cumulative OR for gender and summarising this relationship in a single OR misses this observation. Thus gender may well be the major factor underlying the overall rejection of the PO assumption. There are partial proportional odds (PPO) models that allow the assumption of PO to be relaxed for one or a small subset of explanatory variables, but retained for the majority of explanatory variables. In the present case it might be apposite to run such a model, relaxing the PO assumption for the gender variable. However this requires restructuring of the dataset which is beyond the scope of this web resource. The reader is referred to O’Connell (2006) p48-54 for further detail on PPO models. For the current analysis, inspection of the separate ORs for a series of binary logistic regressions suggests it is reasonable to conclude the ordinal PO model is a fair summary of the patterns in the data in relation to tier of entry, but noting that the under-representation of girls is specific to the top tier and should not be assumed to generalise across all cumulative splits in the data. |