-
- Mod 5 - Ord Reg
- 5.1 Introduction
- 5.2 Ordinal Outcomes
- 5.3 Assumptions
- 5.4 Example 1 - Ordinal Regression on SPSS
- 5.5 Teacher Expectations and Tiering
- 5.6 Example 2 - Ordinal Regression for Tiering
- 5.7 Example 3 - Interaction Effects
- 5.8 Example 4 - Including Prior Attainment
- 5.9 Proportional Odds Assumption
- 5.10 Reporting the Results
- 5.11 Conclusions
- 5.12 Other Categorical Models
- Quiz
- Exercise
- References
- Mod 5 - Ord Reg
Using Statistical Regression Methods in Education Research

5.5 Teacher Expectations and Tiering
|
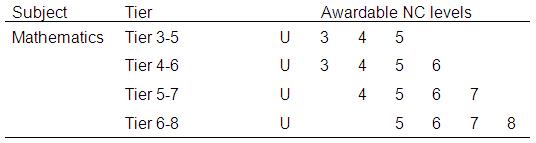
We will now complete a more complex ordinal regression employing multiple explanatory variables. For this example we are going to use a different outcome variable, the mathematics test tier that teachers entered the student for. We give the background to this example below: As we said earlier, at the time they were recruited to LSYPE all students in England completed national tests in English, mathematics and science at the end of Year 9 (age 14). These tests awarded pupils a National Curriculum (NC) level with the ‘typical’ student at age 14 expected to achieve Level 5 or Level 6. The range of levels that can be awarded at age 14 range from 3-7, although a Level 8 can be awarded specifically in the mathematics test. In some subjects there are different tests to reflect different levels of ability. These different tests are organised into ‘tiers’. There are no tiering arrangements for national tests in English at age 14 - all students sit the same test papers. In Science there are only two tiers (a lower tier covering levels 3-6 and a higher tier covering levels 5-7). However for mathematics there are four test tiers covering levels 3-5, 4-6, 5-7 and 6-8 respectively. Importantly each tier has different test papers targeted at a restricted set of levels. This is summarised in Figure 5.5.1. For example, the highest outcome (Level 8) can only be achieved if the student is entered by their teacher for the highest (6-8) tier. Equally Level 7 can only be achieved if the student is entered for either of the two highest tiers (tier 5-7 or tier 6-8). Importantly which tier a student is entered for is a matter for the professional judgment of the teacher. This is quite a ‘high-stakes’ judgment since an unclassified (U) grade results if a student entered for a higher tier fails to achieve the expected level. Equally, placing the student in too low a tier can prevent them from getting the maximum grade they may be capable of. This judgement may well be influenced by other factors determining the teacher’s perceptions of how students will cope with the demands made on them by the content and structure of the tests. Table 5.5.1: Tiering structure for age 14 national tests in mathematics
Notes: The numbers indicate National Curriculum (NC) levels that can be achieved through the relevant tier. U = unclassified result. The essential point is that the outcome a student can achieve in the mathematics test will be constrained by the tier their teacher has entered them for, and there are social processes that may influence this decision. The research questions we want to address are:
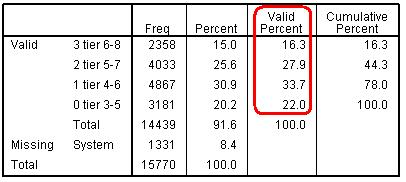
Figure 5.5.2 below shows the proportion of LSYPE students entered for each mathematics test tier. The table was generated by requesting FREQUENCIES (Analyze>Descriptive Statistics>Frequencies) for the variable k3matier and using the ‘Format’ button to request it to be ‘Ordered by’ descending values. Figure 5.5.2: Frequency distribution in entry to different mathematics test tiers
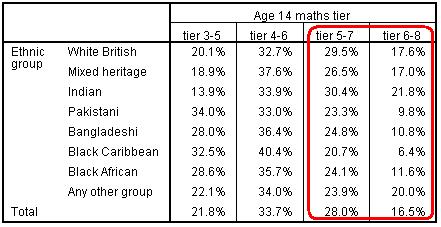
Overall 16.3% of students are entered for tier 6-8, 27.9% for tier 5-7, 30.9% for tier 4-6 and 22.0% for tier 3-5. As shorthand, we shall call these top, upper, lower and bottom tiers respectively. Cumulatively 16.3% are entered for the top tier, 44.3% for the upper tier or above and 78% for the lower tier or above. What we want to establish in the ordinal regression is whether there is any systematic relationship between our explanatory variables (SEC, ethnic group and gender) and the probability of being entered to a higher tier. So do tier entry rates vary by our equity factors? The first step, as ever, is just some simple bivariate analyses (crosstabs) to see what patterns exist in the data (Figure 5.5.3, Figure 5.5.4 and Figure 5.5.5). The data show a strong association between ethnic group and tier of entry. Students of Mixed Heritage and Any Other ethnic group do not differ greatly from White British, and Indian students appear more likely than White British students to be entered for the higher tiers. However, while 47% of White British students are entered for the upper and top tiers, only 35% of Bangladeshi and Black African students, 33% of Pakistani students and 27% of Black Caribbean students are entered for these two tiers. Figure 5.5.3: Tier entry by ethnic group
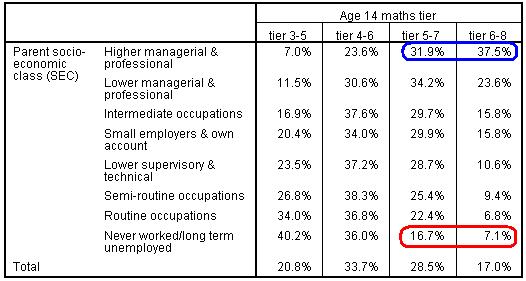
There is also a strong association with the SEC of the home. Thus while 69% of students from higher managerial & professional homes are entered for the upper and top tiers, only 24% of children from the lowest SEC homes are entered.
Figure 5.5.4: Tier entry by socio-economic classification (SEC)
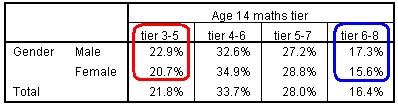
The gender difference is small relative to the SEC and ethnic group differences. The pattern of gender entry seems to vary by tier, so boys are both more likely than girls to be entered for the lowest tier (22.9% vs 20.7%) and also more likely to be entered for the highest tier (17.3% vs. 15.6%).
Figure 5.5.5: Tier entry by gender
What we do not know from these simple bivariate relationships is how our variables interrelate when considered together, to do this we need to build a model. Our primary focus in the analysis is to explore the ethnic group differences in tier entry rates, to try and understand why ethnic minority students are so much less likely to be entered for the higher tiers, and to see whether the association seen above can be explained by other variables in the dataset. |