-
- Mod 4 - Log Reg
- 4.1 Overview
- 4.2 Odds, Odds Ratios and Exponents
- Quiz A
- 4.3 A General Model
- 4.4 Log Reg Model
- 4.5 Logistic Equations
- 4.6 How good is the model?
- 4.7 Multiple Explanatory Variables
- 4.8 Methods of Log Reg
- 4.9 Assumptions
- 4.10 Example from LSYPE
- 4.11 Log Reg on SPSS
- 4.12 SPSS Log Reg Output
- 4.13 Interaction Effects
- 4.14 Model Diagnostics
- 4.15 Reporting the Results
- Quiz B
- Exercise
- Mod 4 - Log Reg
Using Statistical Regression Methods in Education Research

4.7 Multiple Explanatory Variables
|
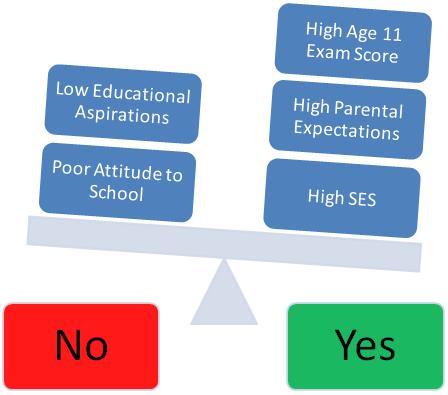
As with linear regression, the more information we have to predict the outcome the more likely it is that we will be able to develop good models. Like multiple linear regression, multiple logistic regression allows the researcher to add many explanatory variables to the model. For example, if we know about the student’s prior attainment, their gender, their attitude to school, their socio-economic status, their parent’s expectations for them and so on, we can use all the explanatory variables together to better estimate which category of the outcome variable they will most likely fall into (see for example Figure 4.7.1 below). Figure 4.7.1 Multiple explanatory variables used to make classifications for binary variables Of course this will be true only if our additional explanatory variables actually add significantly to the prediction of the outcome! As in linear regression, we want to know not only how well the model overall fits the data, but also the individual contributions of the explanatory variables. SPSS will calculate standard errors and significance values for all variables added to our model, so we can judge how much they have added to the prediction of the outcome.
As in linear regression we want to know not only how the model overall fits the data but also the individual contribution of the explanatory variables. The use of the Wald statistic is analogous to the t-test performed on the regression coefficients in linear regression to test whether the variable is making a significant contribution to the prediction of the outcome, specifically whether the explanatory variable’s coefficient is significantly different from zero. SPSS calculates and reports the Wald statistic and importantly the associated probability (p-value). Some caution is necessary however when interpreting the Wald statistic. If the coefficient (B) is large then this can result in the standard error becoming disproportionately large which can lead to an inaccurately small Wald statistic. This can result in false conclusions being drawn about the contribution of the explanatory variable to the model (you are more likely to reject the significance of an explanatory variable that is actually important). The Wald statistic is a useful indicator of whether or not an explanatory variable is important but should be interpreted with care! If in doubt you should compare the deviance (-2LL) of a model including the explanatory variable to a previous model without the variable to see whether the reduction in -2LL is statistically significant. We will show you an example of this later.
The above tells us whether an explanatory variable makes a statistically significant contribution to predicting the outcome, but we also want to know the size or magnitude of the association. In linear regression the regression coefficients (b) are the increase in Y for a one unit increase in X. In logistic regression we are not predicting a continuous outcome variable but the log odds of the outcome occurring. Thus in logistic regression the b coefficient indicates the increase in the log odds of the outcome for a one unit increase in X. However as we have seen these log odds (or logits) do not provide an intuitively meaningful scale to interpret the change in the outcome variable. Taking the exponent of the log odds allows interpretation of the coefficients in terms of Odds Ratios (OR) which are substantive to interpret. Helpfully, SPSS gives this OR for the explanatory variable labelled as Exp(B).
Dichotomous (or dummy) explanatory variables For a dichotomous explanatory variable the OR is simply the difference between the odds for the base category (x=0) and the other category (x=1). Thus in our earlier example for gender and aspirations the OR was 2.0 indicating girls (x=1) were twice as likely as boys (x=0) to aspire to continue in FTE. While the OR is sufficient for meaningful interpretation, some researchers also like to express the OR in percentage terms. Subtracting 1 from the OR and multiplying by 100 gives the percentage change. Thus (2-1) *100 = a 100% increase in the odds.
Continuous explanatory variables What about a continuous predictor, like age 11 score? Figure 4.5.1 (on Page 4.5 |