-
- Mod 4 - Log Reg
- 4.1 Overview
- 4.2 Odds, Odds Ratios and Exponents
- Quiz A
- 4.3 A General Model
- 4.4 Log Reg Model
- 4.5 Logistic Equations
- 4.6 How good is the model?
- 4.7 Multiple Explanatory Variables
- 4.8 Methods of Log Reg
- 4.9 Assumptions
- 4.10 Example from LSYPE
- 4.11 Log Reg on SPSS
- 4.12 SPSS Log Reg Output
- 4.13 Interaction Effects
- 4.14 Model Diagnostics
- 4.15 Reporting the Results
- Quiz B
- Exercise
- Mod 4 - Log Reg
Using Statistical Regression Methods in Education Research

4.10 An Example from LSYPE
|
Now that we have discussed the theory underlying logistic regression let’s put it into practice with an example from the LSYPE dataset. As we have said, in England, the success of education is often judged by whether a student achieve five or more GCSE at grades A* - C’, including the subjects of English and maths, when they take these exams at age 16 (our humble fiveem variable). This criterion is considered a benchmark of academic success - it can dictate whether or not a student is advised to continue their studies after the age of 16 and it plays a role in deciding which courses of study are available to them. You will know by now that we have a strong research interest in equity issues in relation to educational achievement. So for this example we will explore the extent to which ethnicity, social class and gender are associated with the probability of a student achieving 5 or more GCSE A*-C grades including English and maths (fiveem).
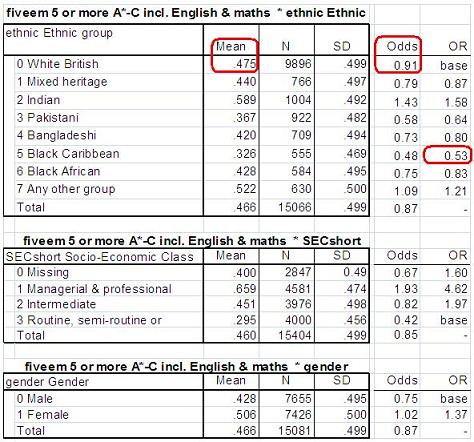
As with all research we should not run straight to the statistical analyses, even though this might be the sexier bit because it is so clever! The starting point should always be simple descriptive statistics so we better understand our data before we engage with the more complex stuff. So what is the pattern of association between our key variables of ethnicity, SEC and gender and fiveem? Remember, as we said on Page 4.2, Figure 4.10.1: Mean, N and SD of fiveem by student background variables Note: You will remember from module 2 that LSYPE was unable to code the SEC of the head of household for quite a large proportion (18%) of LSYPE students. These cases are coded 0 which has been defined as the missing value for SECshort. However, we do not want to lose this many cases from the analysis. To include these cases we have redefined the missing values property for SECshort to ‘no missing values’. This means that those cases where SEC is not known (0) are included in the above table. We will explain how we to do this on Page 4.13. We see that the proportion of White British students achieving fiveem is 48%. The proportion is substantially higher among Indian students (59%) and substantially lower among Black Caribbean students (33%), with the other ethnic groups falling in between these two extremes. There is also a substantial association between SEC and fiveem. While 29% of students from low SEC home achieve fiveem, this rises to 45% for students from middle SEC homes and 66% for students from high SEC homes. Finally there is also a difference related to gender, with 43% of boys achieving fiveem compared to 51% of girls. In the table you will see that we have also calculated and included the odds and the odds ratios (OR) as described on Page 4.2 |