-
- Mod 4 - Log Reg
- 4.1 Overview
- 4.2 Odds, Odds Ratios and Exponents
- Quiz A
- 4.3 A General Model
- 4.4 Log Reg Model
- 4.5 Logistic Equations
- 4.6 How good is the model?
- 4.7 Multiple Explanatory Variables
- 4.8 Methods of Log Reg
- 4.9 Assumptions
- 4.10 Example from LSYPE
- 4.11 Log Reg on SPSS
- 4.12 SPSS Log Reg Output
- 4.13 Interaction Effects
- 4.14 Model Diagnostics
- 4.15 Reporting the Results
- Quiz B
- Exercise
- Mod 4 - Log Reg
Using Statistical Regression Methods in Education Research

4.15 Reporting the Results of Logistic Regression
|
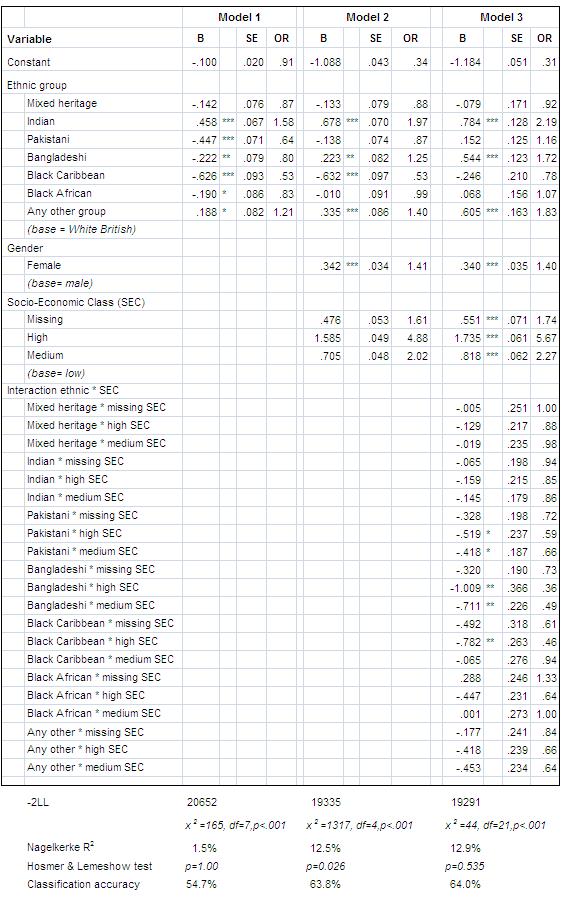
Our interest here has been not only in the association between ethnic group, social class, gender and exam achievement, but also how the relationship between ethnic group and exam achievement changes as we account for other explanatory variables (like SEC) and interaction effects. It is therefore appropriate to present the results not just for the last model but also for the preceding models. In a report we would present the results as shown in the table below. Model 1 shows the simple association between ethnic group and the fiveem outcome. Model 2 shows what happens when we add SECshort and gender to the model. Model 3 shows the significant interaction that exists between ethnic group and SECshort which needs to be taken into account. Summarising the results of the three models alongside each other in this way lets you tell the story of your analysis and show how your modelling developed. The elements of this table (Figure 4.15.1) that you choose to discuss in more detail in your text will depend on the precise nature of your research question, but as you can see it provides a fairly concise presentation of nearly all of the key relevant statistics. Figure 4.15.1: reporting the results of logistic regression
If you want to see an example of a published paper presenting the results of a logistic regression see:
We hope that now you have braved this module you are confident in your knowledge about what logistic regression is and how it works. We hope that you are confident about creating and interpreting your own logistic regression models using SPSS. Most of all we hope that all of the formula has not frightened you away… Logistic regression can be an extremely useful tool for educational research, as we hope our LSYPE example has demonstrated, and so getting to grips with it can be a very useful experience!
Whew… why not have a little lie down (and perhaps a stiff drink) and then return to test your knowledge with our quiz and exercise? |