-
- Mod 4 - Log Reg
- 4.1 Overview
- 4.2 Odds, Odds Ratios and Exponents
- Quiz A
- 4.3 A General Model
- 4.4 Log Reg Model
- 4.5 Logistic Equations
- 4.6 How good is the model?
- 4.7 Multiple Explanatory Variables
- 4.8 Methods of Log Reg
- 4.9 Assumptions
- 4.10 Example from LSYPE
- 4.11 Log Reg on SPSS
- 4.12 SPSS Log Reg Output
- 4.13 Interaction Effects
- 4.14 Model Diagnostics
- 4.15 Reporting the Results
- Quiz B
- Exercise
- Mod 4 - Log Reg
Using Statistical Regression Methods in Education Research

4.5 Interpreting Logistic Equations
|
We have seen that if we try to predict the probabilities directly we have the problem of non-linearity, specifically the floor at 0 and the ceiling at 1 inherent in probabilities. But if we use our explanatory variables to predict the log odds we do not have this problem. However while we can apply a linear regression equation to predict the log odds of the event, people have a hard time understanding log odds (or logits). Remember that a logit is just a log of the odds, and odds are just are a function of p (the probability of a 1). We can convert the log odds back to odds by applying the reverse of the log which is called the exponential (sometimes called the anti-logarithm) to both sides. Taking the exponent eliminates the log on the left handside so the odds can be expressed as: p/(1-p) = Exp(a+bx). We can also rearrange this equation to find the probabilities as: p= Exp(a+bX) / [1 + Exp(a+bX )] which is the logistic function, which converts the log odds to probabilities. So now rather than log odds or logits, which people are not happy talking about, we can talk about odds and probabilities, which people are happier talking about (at least relatively!).
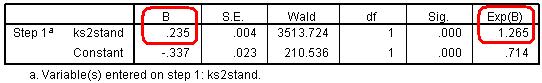
So let’s return to our example of modelling the probability of achieving five or more GCSE A*-C grades including English & maths (fiveem) from age 11 test score. The SPSS logistic regression output is shown in the table below. Figure 4.5.1: Logistic regression for Fiveem by age 11 score
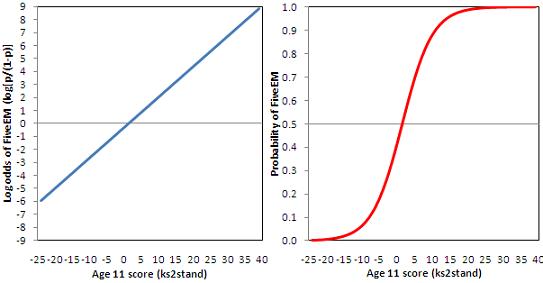
The B coefficients describe the logistic regression equation using age 11 score to predict the log odds of achieving fiveem, thus the logistic equation is: log [p/(1-p)] = -.337 + .235 * age 11 score. Figure 4.5.2 lets us visualise the equation. The left hand chart shows the linear relationship between age 11 score and the log odds of achieving fiveem. This line has an intercept of -.337 and a slope of .235 and is clearly linear. However we can use the logistic function to transform the log odds to predicted probabilities, which are shown in the right hand chart. Looking back to Figure 4.4.1 on Page 4.4 Figure 4.5.2: Relationship between age 11 score and (a) the log odds of achieving 5+ GCSE A*-C including English & maths (b) the probability of achieving 5+ GCSE A*-C including English and maths. The logistic regression equation indicates that a one unit increase in age 11 test score is associated with a .235 increase in the log odds of achieving fiveem. Taking the exponent of the log odds, indicated in the output as Exp(B), gives the Odds Ratio, which shows that a one unit increase in age 11 test score increases the odds of achieving fiveem by a multiplicative factor of 1.27. Various procedures also exist to calculate the effects of a unit change in the b on the probability of Y occurring. However the effect on probabilities depends on the point of the logistic curve at which the effect is calculated (e.g. a one unit change in age 11 score from -10 to -9 would give a different change in the predicted probability than a one unit change in age 11 score from 0 to 1). This is why we typically stick to ORs as the main way of interpreting the logistic regression results. (For more detail on interpreting coefficients see Pages 4.10
So in summary we have seen that when attempting to predict probabilities (which we are doing when we model binary outcomes) linear regression in inappropriate, both for statistical and conceptual reasons. With binary outcomes the form of the relationship between an explanatory variable X and the probability of Y is better modeled by an S-shaped curve. While the relationship between X and the probability of Y is non-linear (it is in fact curvilinear), and therefore cannot be modeled directly as a linear function of our explanatory variables, there can be a linear and additive combination of our explanatory variables that predict the log odds, which are not restricted by the floor of 0 and ceiling of 1 inherent in probabilities. These predicted log odds can be converted back to odds (by taking the exponential) and to predicted probabilities using the logistic function. |