-
P Value
The P-value (sometimes called the alpha-level) refers to the probability that an effect or relationship has occured in your sample simply by chance. It is the likelihood that an observed effect could have occurred due to the chance factors such as sampling variation. A p-value of less than .05 (p<.05) indicates there is less than a 5% (or
one
in twenty) probability that the effect seen is a result of chance factors and is conventionally considered acceptable for rejecting the null hypothesis and concluding that the effect is statistically significant.
-
P-P Plot
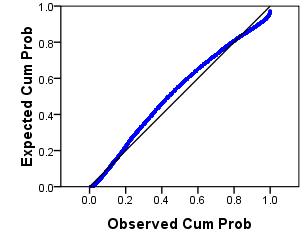
With regard to regression analysis, the P-P plot (probability-probability plot) is used to check that the residuals are normally distributed. You do not have to worry too much about how the graph is created as SPSS will do it for you (it involves cumulative probability functions, for those who are interested!). Basically, the straight
diagonal line in the middle represents a normal distribution while the plotted points represent the residuals. The graph allows you to visually compare how similar the distribution of your residuals is to a normal distribution. A P-P plot is shown below:
-
Pair-wise Comparison
A pairwise comparison refers to a comparison of a pair of means (usually two groups or levels of a variable). Where the explanatory variable has more than two values there will be multiple pairwise comparisons. For example if the explanatory variable has five values then there are a total of 10 possible pairwise comparisons.
-
Parameter
A parameter of a model is essentially a fixed value within the model (e.g. a constant such as a one unit change in an explanatory variable when predicting an outcome variable). This is different to a variable, which has many different values that depends on the individual case.
-
Parametric Tests
- Parametric tests are based on the assumption that data comes from a type of probability distribution that the researcher knows the parameters of and can therefore make inferences about. This website refers almost exclusively to the Normal Distribution when referring to parametric tests though there are other types of distributions (with
associated parameters and tests).
-
Parsimony
Parsimony refers to the simplest accurate route of explanation. It is a principle that is important when constructing statistical regression models - we do not want to complicate a model by including unrelated or unnecessary explanatory variables. We are looking for the smallest set of variables that can adequately explain our outcome.
Statistical
criteria are often used in this process, discounting variables that do not add significantly to the accuracy of our predicton.
-
Pearsons correlation coefficient
- Pearson's correlation coefficient, or pearson's r, is a standardized measure of the strength and direction of a relationship between two variables - that is the extent to which when one variable changes the other does. It ranges from -1 to 1 with values of -1 representing the strongest possible negative correlation, 1 representing the
strongest possible positive correlation and 0 representing no correlation.
-
Population
This is the wider set of cases from which our sample is drawn and which we are interested to make generalizations about. A population does not have to be large, but they must all share a defining feature or characteristic (e.g. all students aged 16 in England).
-
Power
Statistical power is really about the ability of a test to detect a particular effect or relationship with a sample. Specifically it is the probability that a given statistical test will reject the null hypothesis when it is indeed false (the probability that a Type II Error will be avoided). Power calculations can be used to
establish the size of a sample you would need to detect an effect of a certain size in your study.
-
Proportional Odds Assumption
This is a key assumption in ordinal regression. The assumption is that the effects of any explanatory variables are consistent (proportional) across the different thresholds (by thresholds we mean the splits between each pair of categories of your ordinal outcome variable). In other words, that the explanatory
variables
have the same effect on the odds regardless of the threshold.
SPSS tests this assumption with what it calls the Test of parallel lines but it is referring to the same assumption. If the test is statistically significant then we must reject the hypothesis of proportional odds and our model may be better conceived as a series of binary logistic regressions. This is discussed in
detail in the Ordinal module (module 5).

