Creating Thematic Maps in SASPAC and MapShore
In this example we will create two choropleth (thematic) maps using MapShore in association with SASPAC.
The two maps will display census-type attributes for the same area as other MapShore examples. The first
map will display categorical area classification information while the second one shows percentage of
residents who drive to work by a car or van.
First, click [here] to download "
.zip". Save the file to a suitable folder and unzip its content.
The zip file contains a polygon shapefile that has the boundaries of four fictitious neighbourhood areas
and the associated SASPAC System file "
.sys" which are needed for this example. SASPAC system files are normally available from the
software installation media or downloadable from the Data Directory link in the SASPAC website which is
regularly updated.
Preparing Area Data for MapShore using SASPAC
The first task is to select the areas and variables required for mapping and to export these from SASPAC
as a CSV file.
Start SASPAC. Choose "Export CSV file" and then click OK if the Quickstart task menu is
displayed otherwise select File > New Task > Export data > CSV File... to start building the
thematic map.
In the Export CSV File dialog box, click Other Files... and navigate to the location where the sample
data have been stored. Open the "
.sys" system file which contains the example data. The two variables included in the file are
"SUPERGROUP" and "KS0159007". The first variable belongs to the Office for National Statistics (ONS)
Output Area Classification which is used to describe the top level of the area classification ranging
from 1 to 7. The second one is one of the census table Key Statistics (KS) variables used in 2001
Census. In this example we used "KS0159007" which records the percentage of people who drive
to work using a car or van. To continue with the example, enter "SUPERGROUP" and "KS0159007"
manually in the Selected Variable Name(s) textbox within the Variables box.
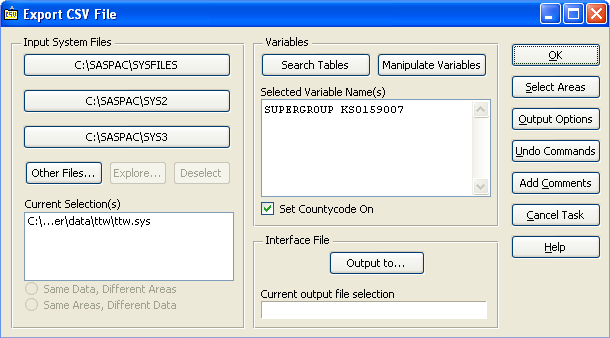
Click the Select Areas button to identify the area that is covered by the sample data. In the Select
Areas dialog box, click View Data (available in the Explore Zones tab which should be the default). The
area data will be displayed. Click the hatched green "00AD?" box to the left of the "OAs
in Bexley" label. Choose Include to select all the areas.
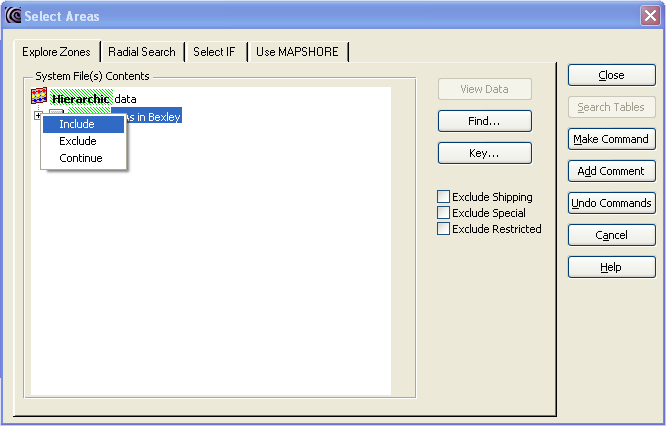
The colour of the "00AD?" box will become solid green to indicate that the areas are
successfully included. Click Make Command to transfer the area selection list to the main SASPAC
command. The "00AD?" box will now revert back its original colour (pale hatched green). Click
Close to terminate the area selection process.
SASPAC will now return to the Export CSV File dialog box. Click Output to... and enter "
.csv" as the output file name (please note that SASPAC may automatically change the filename to all
uppercase when a file is created). You are advised to accept the default file location which is the
"\INTERFAC\" subfolder under the SASPAC program on the system. Click OK and then Yes (when
prompted for adding ZONEID) to continue.
In the Task dialog box, accept the default settings and click OK to run the SASPAC commands. When the
process is completed successfully, the log file dialog box will be displayed.
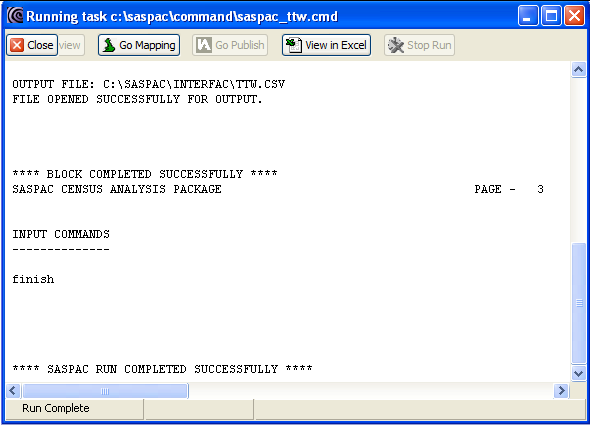
We have now created the area data containing a zone reference ("ZONEID"), area classification
(SUPERGROUP") and the percentage of car or van usage for commuting ("KS0159007"). Click
the "Go Mapping" button to launch MapShore to map the results.
Mapping Categorical Data in MapShore
In the MapShore window, select Boundary > Retrieve... and navigate to the location where the boundary
file ("
.shp") is saved. Open the file which will display the area ID and name assignment dialog box.
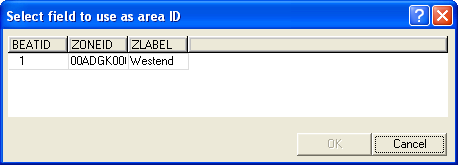
Click the "ZONEID" label and then OK to set it as the area ID. You will then be prompted to
select a field as area name, this time click the "ZLABEL" label and then OK. The boundary data
should now appear.
Select Data > Retrieve Area Data... to import the area classification to the current boundary map.
Navigate to the "\INTERFAC\" folder of the SASPAC program (which is normally under "C:\SASPAC\").
Open the area data file ("
.csv" - SASPAC is not case sensitive when handling filename). You will then be prompted to choose
one of the two attributes to be displayed on the map.
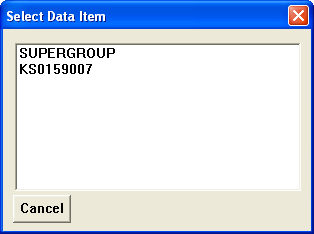
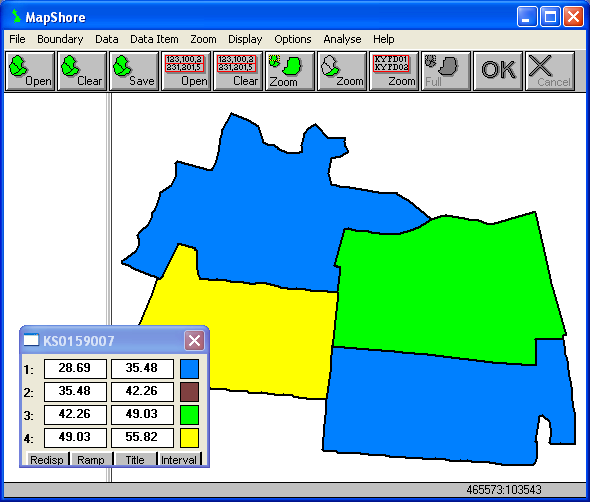
Select "SUPERGROUP" and the four neighbourhood areas will be coloured according to their area
classification code. A zonal key should also be shown. In case the zonal key is not visible, you will
need to select Display > Zonal Key to turn on the key.
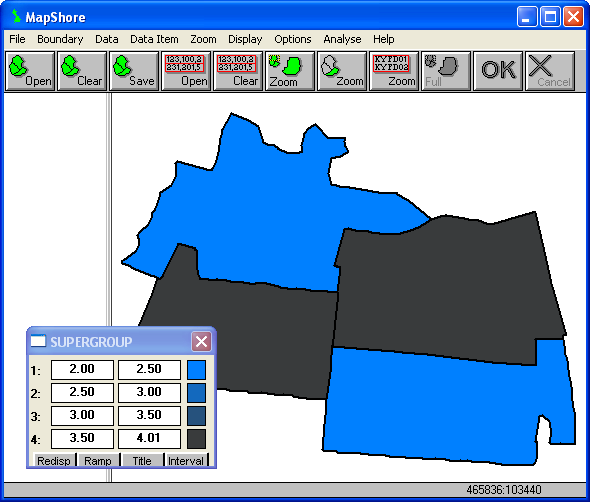
It is unlikely that the data type and range will be appropriate in the first instance. Click the Interval
button on the zonal key and alter the values as follows:
Click Ok to save and apply the changes. If the default colour scheme does not provide a clear
representation of the areas, change the colour by clicking on the colour squares in the key. Click the
"Redisp." button on the zonal key to apply any changes made.
Use the Export or Print commands to generate an output file. Save the results to a MapShore Library
(.LIB) file which is needed in the final step of this example. Accept the default folder location
(normally "C:\SASPAC\MAPPING\") and name the file as "ttw_oac". Close both MapShore
and SASPAC to clear the current data selection and outputs before proceeding to the next part of this
example.
Mapping Continuous Data in MapShore
Start MapShore (if it is not already running). Select Boundary > Retrieve... and navigate to the
location where the boundary file ("
.shp") is saved. Open the file which will display the area ID and name assignment dialog box.
As you have done previously, click the "ZONEID" label and then OK to set it as the area ID.
Then click the "ZLABEL" label and OK to make "ZLABEL" the area name.
After the boundary data have appeared, select Data > Retrieve Area Data... to import the car usage
attributes to the current map. Navigate to the "\INTERFAC\" folder of the SASPAC program
(which is normally under "C:\SASPAC\"). Open the area data file ("
.csv" - SASPAC is not case sensitive when handling filename). You will then be prompted to choose
one of the two attributes to be displayed on the map. Select "KS0159007" this time and the
neighbourhood areas will be coloured according to the attribute data. A zonal key should also be shown.
In case the zonal key is not visible, you will need to select Display > Zonal Key to turn on the key.
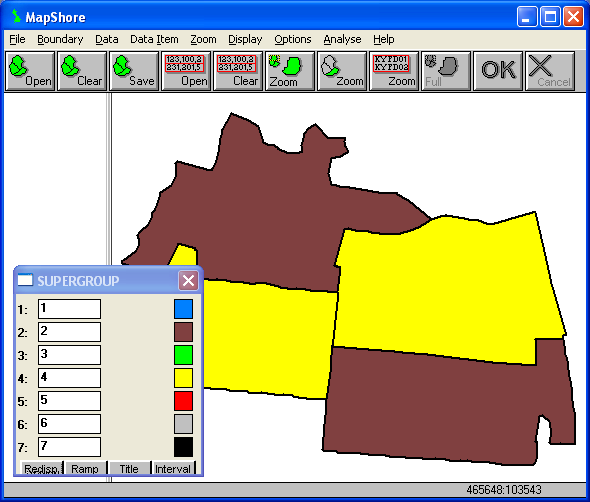
It is unlikely that the data type and range will be appropriate in the first instance. Click the Interval
button on the zonal key and alter the values as follows:
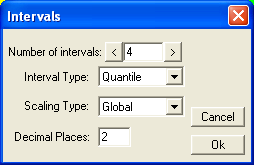
Click Ok to apply the changes. Click the "Ramp" and then the "Redisp." buttons on the
key to change the multi-coloured scheme to a graduated shading pattern which is better for mapping
continuous data.
Use the Export or Print commands to generate an output file. If you intend to use the results in future,
save the work to a MapShore Library (.LIB) file as "ttw_caruse". Close both MapShore and
SASPAC to clear the current data selection and outputs before proceeding to the last part of this
example.
Displaying Both Categorical and Continuous Data in MapShore
The Map Type option in MapShore allows users to display the values of up to three datasets using either
zonal and proportional (rectangular or circular) symbols. It is thus possible to display the area
classification together with the percentages of commuting by private car or van for this example on the
same map.
Start MapShore if it is not already running. Select File > Retrieve Library File... to open the "ttw_oac.lib"
which is saved when the categorical attribute data are being mapped. The default location of that file
should be in "C:\SASPAC\MAPPING". Select "ZONEID" as the area ID and then "ZLABEL"
as the area name. The area classification map should be displayed.
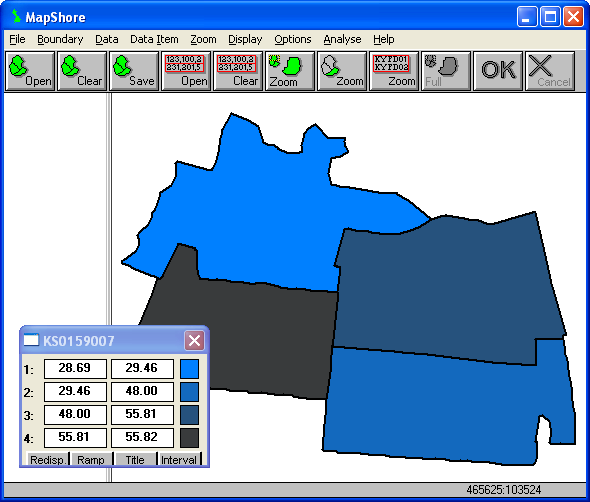
Select Options > Map Type > Graduated Circles. Choose to map attributes "KS0159007" in
the Select Data Item dialog box. Turn on the Graduated Circle Key via Display > Graduated Key which
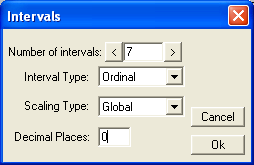
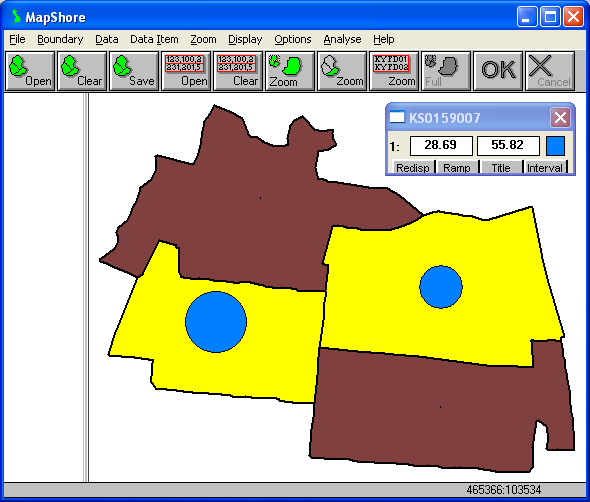
allows you to adjust the interval and colour of the data. Click on the Interval button on the Graduated
Circles Key (which should have the "KS0159007" label) and change the Number of intervals: to
"1". Click Ok and the map will show a series of graduated circles proportionally sized to the
number of offences within the areas.
Use the Export or Print commands to generate an output file. If you intend to use the results in future,
save the work to a MapShore Library (.LIB) file.
Copyright Attribution
The Small Area Statistics Package (SASPAC) software is owned by the Improvement and Development Agency
for Local Government (IDeA). MapShore is a registered trademark of Pebbleshore Ltd. The software screen
shots shown in this page are reprinted with permission from IDeA and Pebbleshore Ltd. The maps shown
above are based on data provided through EDINA UKBORDERS with the support of the ESRC and JISC and uses
boundary material which is copyright of the Crown.
 Homepage