Mapping School Locations in MapShore
For this example, we shall use MapShore which is supplied with SASPAC to map the location of the primary
schools in Newham. The point data are stored in "
_bycoord.csv" which should have been generated in another part of the workshop examples. We will
also plot the output areas (OAs) in Newham to provide context for you map. Two additional files are
further required to complete this part of the exercise: the associated point setup file "
_bycoord.set" and the boundary data "00BBA_Newham_CAs.bdy". Both files are among the unzipped
content of "
.zip" that should have been downloaded at the beginning of the workshop.
If you did not attend the workshop or complete the prerequisite steps before reaching this part of the
exercise, you can click [here] to download the zip
archive of the working data.
Retrieving Boundary Data in MapShore
If running MapShore in association with SASPAC, start SASPAC. Choose "Start MapShore" and then
click OK if the Quickstart task menu is displayed otherwise select File > Run MAPSHORE. MapShore may
also be run independently.
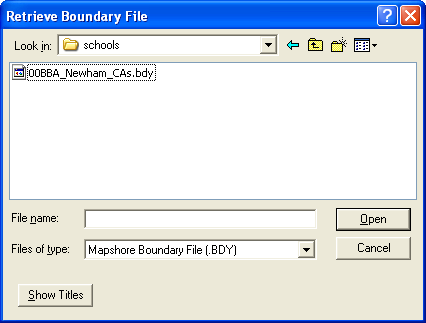
When the MapShore window appears, select Boundary > Retrieve... to import the boundary data. Navigate
to the location where the boundary data is saved and open the file. Make sure that the Files of type: is
set to "BDY" which is the native boundary data for MapShore.
The boundary data of all the OA zones in Newham should now appear.
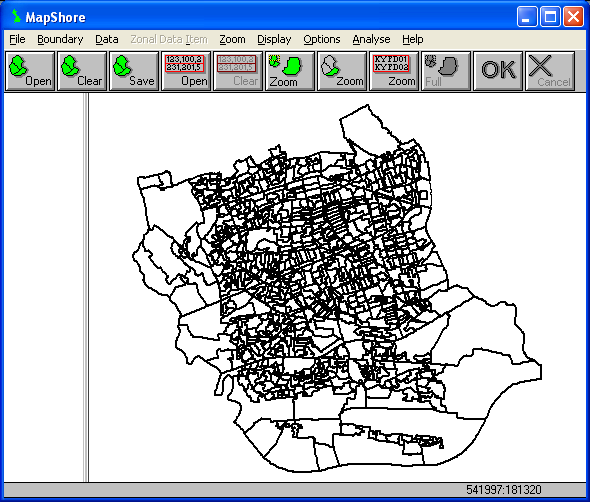
After the boundary data have been retrieved, the areal extent for mapping the point data file is
automatically set and the school performance data can be added to the map display.
Mapping point data in MapShore
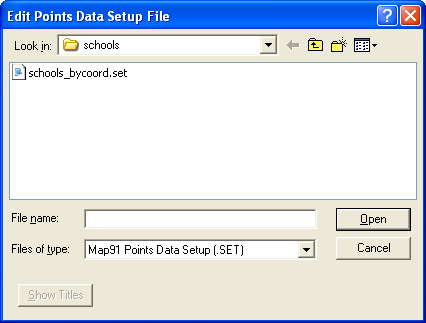
Select Data > Edit Point Data Setup File... to define the characteristics of the additional attribute
data in the new point data file which is to be imported. Navigate to the location where all the other
data files are and open the associated SET file ("
_bycoord.set").
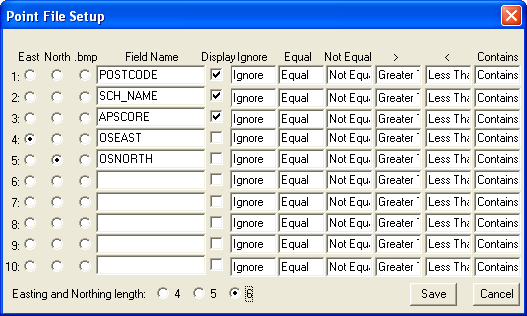
The Point File Setup dialog box will appear. Up to ten fields can be stored in the setup file. The Field
Name column contains the field labels for each record for the
data file provided in this example. Five data fields are to be included in the point setup file: "POSTCODE",
"SCH_NAME" (school name), "APSCORE" (KS2 average point score), "OSEAST"
(eastings) and "OSNORTH" (northings). Click the Display checkboxes for the first three fields
to include these attributes on the map. Note that the East and North radio buttons are used to indicate
the data for eastings and northings respectively. Their length should be set to "6" in most
cases. Also important to note is that the eastings and northings fields should be placed at the last two
columns in the input data file.
Accept the remaining default values. Click Save to update the point data setup file.
Select Data > Retrieve Point Data... and open "
_bycoord.csv". The CSV file should have been created in another part of the workshop examples ("Getting
grid coordinates from postcodes"). Choose an appropriate symbol to represent the school locations.
The colour of the symbol can be changed afterwards via Options > Colours > Set Symbol Colours...
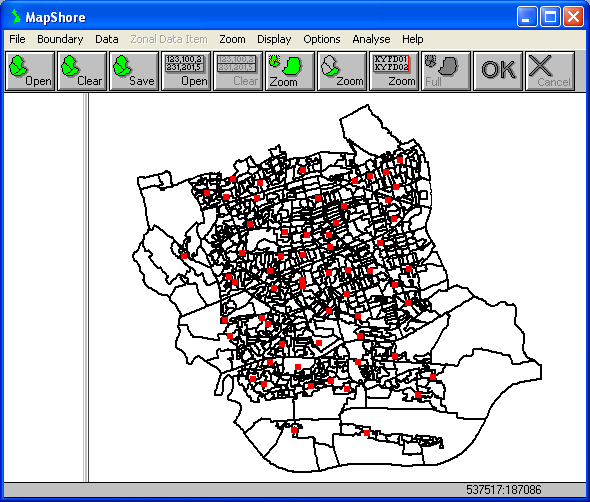
As we want to map all the schools irrespective of their score, ignore the filtering options offered in
the "Point Data Filter" dialog box. Click Ok and all 61 primary schools in Newham should now
be displayed on the map.
The results can now be exported using the Export or Print commands. Save the work to a MapShore Library
(.LIB) file for use in the future.
Copyright Attribution
The Small Area Statistics Package (SASPAC) software is owned by the Improvement and Development Agency
for Local Government (IDeA). MapShore is a registered trademark of Pebbleshore Ltd. The software screen
shots shown in this page are reprinted with permission from IDeA and Pebbleshore Ltd. The maps shown
above are based on data provided through EDINA UKBORDERS with the support of the ESRC and JISC and uses
boundary material which is copyright of the Crown.
 Homepage