 Homepage Research Staff Publications Useful Links
 Maps may be of many different types. Diverse examples include:
 |
 |
 |
| Map A | Map B | Map C |
 |
 |
| Map D | Map E |
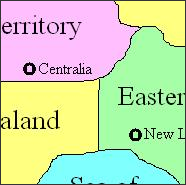
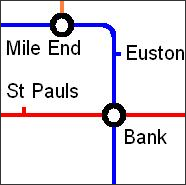
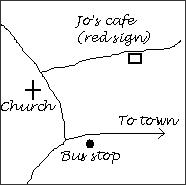
Each of these maps is a graphical representation of selected features from the "real" world. Features which are considered of relevance to one map will be omitted from others - for example a subway route map does not contain many (if any) above-ground features such as streets or landmarks, whereas these may be the only elements of a sketch map for finding a restaurant.
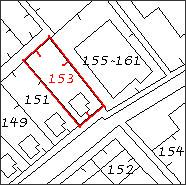
In each of these maps a distance measured on the graphical representation will represent very different distances in the real world. If each of these maps were reproduced on equally-sized pieces of paper, the total width of an entire world map would be approximately 40,000 km (the circumference of the earth) while the sketch map may span only a few hundred metres. A brief consideration of these different maps also reveals that some are produced to exact scales, some incorporate deliberate distortions of scale and some may give little or no consideration to scale at all. The legal plan of land parcels and the map of the countryside will usually be produced to exact scales and the scale will be clearly marked. A sketch map may include marginal information related to scale such as 'about 100m from bus stop', although this distance could not be accurately measured from the map itself. Schematic diagrams of subway systems and world maps include complex design considerations with the result that distances on the map do not correspond to fixed distances in the real world - a centimetre measured close to the city centre on the subway plan will usually represent a much shorter distance than a centimetre at the edges of the city.
 There are
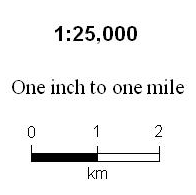
several ways of describing scale on these maps. One convention is to use representative fractions such
as 1:25,000 to indicate that one unit of length on the map represents 25,000 units in the real world. A
second is to use equivalent distances such as 'one inch to one mile' to indicate that one inch on the
map represents one mile in the real world. A third approach, often used in combination with the first
two, is to include a scale bar within the map graphic, which indicates real world distances. We say that
a map at the scale of 1:10,000 is at a larger scale than a map at 1:50,000 because the representative
fraction 1/10000 is a larger value than 1/50000. Scale bars have an important advantage that their size
relative to the map is preserved during reproduction of the map by scanning and photocopying processes.
There are
several ways of describing scale on these maps. One convention is to use representative fractions such
as 1:25,000 to indicate that one unit of length on the map represents 25,000 units in the real world. A
second is to use equivalent distances such as 'one inch to one mile' to indicate that one inch on the
map represents one mile in the real world. A third approach, often used in combination with the first
two, is to include a scale bar within the map graphic, which indicates real world distances. We say that
a map at the scale of 1:10,000 is at a larger scale than a map at 1:50,000 because the representative
fraction 1/10000 is a larger value than 1/50000. Scale bars have an important advantage that their size
relative to the map is preserved during reproduction of the map by scanning and photocopying processes.
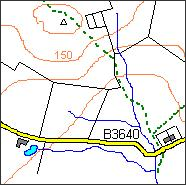
Large scale maps generally cover smaller areas in more detail than small scale maps. Although a sketch map might include a scale bar to indicate a distance such as 1km, this type of map is by definition 'not to scale' because the various features on the graphic have not been exactly measured and positioned. Any attempt to describe the scale of the world map or subway plan can only be approximate because the scale varies within the diagram. Only the property ownership map and the detailed topographic map of the countryside have exact and consistent scales.
If a property ownership map originally surveyed and produced at a scale of 1:1,250 were to be reproduced at exactly half the size, it would become a map at a scale of 1:2,500. In this case we could probably still trust the distances on the map, although small features may be increasingly difficult to see. However, if a small section of a countryside map originally produced at 1:25,000 were magnified ten times and reproduced at a scale of 1:2,500 it would be extremely difficult to determine the exact locations of features. The lines on the map would be ten times thicker than in the original and many features that we might expect to find on a map at 1:1,250 scale would not be present. This selection of features for inclusion in relation to the intended scale of reproduction is known as generalization and is another important feature of map production: large scale maps include more detail than small scale maps.
When using geographical data for georeferencing purposes it is particularly important to know whether they have been derived from existing maps and at what scale. Computer mapping - whether on the web or using local mapping software - makes it very easy to zoom in or out, which will affect the scale of the map displayed. However, unless different sets of underlying data are used at the various levels of zoom, there will be a tendency to inappropriately condense or magnify the features on the map. Particular care must be taken with map references embedded within geographical datasets such as point locations or geographical boundary files as these cannot represent true geographical features more precisely than was possible at their original scale, whatever manipulations may subsequently have been applied to them. This can pose particular problems when linking or mapping geographical features which have been derived from differently scaled maps: features from a map of the countryside (Map E), however magnified, cannot with any confidence be overlaid on property parcels from a legal plan such as (Map C) if the intention is to determine whether a path crosses a specific property. Similar situations may arise when geographically referenced data derived from different map scales are combined by data linkage processes, for example when allocating postcode locations to local government wards.