Copyright Attribution
Access™ and Excel® registered trademarks of Microsoft Corporation. The software screen shots shown in this page are reprinted with permission from Microsoft Corporation.
 Homepage Research Staff Publications Useful Links
 In this example we will show how to relate UK postcodes to grid coordinates (eastings and northings) via a lookup table. The coordinates acquired can then be used for mapping the locations of the postcoded data. This operation is best performed using Microsoft Access, where it is a specific instance of the more general task of matching two lists together. Academic users can also perform this task using the GeoConvert tool, which is ideal for small to medium sized datasets post-2006.
Included for this example are a set of postcoded performance data and a lookup table between postcodes and coordinates of the same area. The two source data files " _bypcode.csv" and "lookup_oa_pcode_xy.csv" should be among the unzipped content of " .zip" that you have already downloaded in the beginning of the workshop. If you did not attend the workshop or complete the prerequisite steps before reaching this part of the exercise, you can click [here] to download the zip archive of the working data. Save and unzip the arhive. The two csv files mentioned above should be among the unzipped content.
Start Microsoft Access. Select File > New and click the "Blank database..." icon on the New File pane. Name the blank database as " _bycoord.mdb".
Both data files are in CSV file format so they should be imported to Microsoft Access as external data using the "Text Files (*.txt; *.csv; *.tab; *.asc)" file type option. Please note that both files contain variable labels so the "First Row Contains Field Names" box must be checked. In this particular example, it is important to check that the "Postcode" fields are present in the two newly created tables and the values of the field are in the same format in each. Once successfully imported, a new Query needs to be constructed to link the two datasets together using the "Postcode" field that appears in each, so that there is a means of linking the postcoded data with coordinates. Note carefully how many records there are in each table (this is displayed at the bottom of the window when viewing a table).
Open a new query using the Design view and add both tables. When first added to the query, these tables will by default be linked by the ID field (created automatically by Microsoft Access) but this is not meaningful as the rows in the tables do not correspond. This link may be deleted by right-clicking on it, and a new link created by dragging to connect the "Postcode" field in one table with the same field in the other. Fields from each table can be dragged and dropped into the output grid individually, or dragging and dropping the * symbol will move all fields in the table at once. Include the "Postcode", "SCH_NAME" (school name) , "APScore" (Average Point Score), "OSEAST" (eastings) and "OSNORTH" (northings) fields. When closing the Query you will be prompted to save it, which you should do. Name the query as " _bycoord".
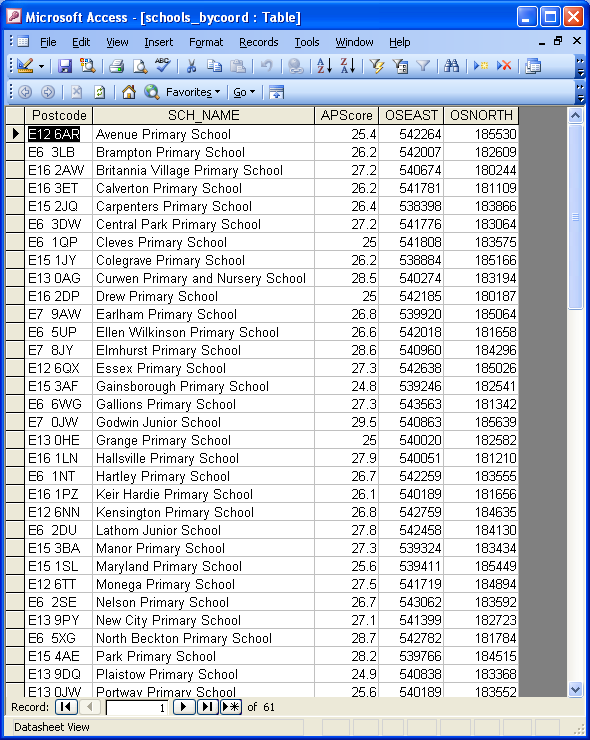
Double-clicking on the saved Query will run it, displaying the result of linking the two tabular datasets by their common field, the "Postcode". We can now see the data displayed in relation to the postcodes and coordinates. The record for each school now contains not only the school name and postcode but also the coordinates of the school's postcode.
Check that the Query has done what you were expecting, including the number of records: there should hopefully be one for each data row! All records from the original data file should now be geo-referenced simultaneously by postcodes and by a pair of eastings (OSEAST) and northings (OSNORTH). Once confident that the correct result has been achieved, the output from this query can then be saved as a table for further work. Right click on the Query to open it again in Design view and from the Query menu choose "Make-Table Query...". Name the table as " _bycoord". Run the query again and it will create a new data table containing the matched data. You can now quit the query without saving. Note that selecting the table and choosing "Design" opens the design view again and allows it to be modified, for example if it has not worked as intended or you wish to re-order the fields in the result.
The results can now be exported using File > Export to an external file for further analysis, for example in Microsoft Excel spreadsheet (.XLS), database (.DBF) or comma-delimited text file (.CSV) formats. These options would also allow the coordinate data to be transferred to a mapping package. In this example, export the table in the CSV format and name the file as " _bycoord.csv".
Access™ and Excel® registered trademarks of Microsoft Corporation. The software screen shots shown in this page are reprinted with permission from Microsoft Corporation.