Linking and Mapping Postcoded School Performance Data
In this example you will use school performance data downloaded from the "School and college
achievement and attainment tables" site. After adding postcode to the schools, you can attach
grid-references to them and then link the postcodes with area codes from the census. This will
enable you to map the locations of the schools, download and link further census data to each school,
and/or calculate and map area-based statistics.
1. Download and add postcodes to school performance data
Please click [here] to download
a postcoded primary school performance tables of the City of Bristol. The csv (comma separated values)
file contains the address, postcode and Key Stage 2 performance data of the primary schools in Bristol.
The original table does not use postcode as a data field so postcode of each school has been added to
the first field of the file. For those who would like to download data of different areas or themes, all
school and college achievement and attainment tables in England are available for download from the
Department for Children, Schools and Families at http://www.dcsf.gov.uk/performancetables/index.shtml.
2. Use GeoConvert to add grid references and to link area data to the school records
Use an Internet browser to login to the GeoConvert service at http://geoconvert.mimas.ac.uk/.
After successfully logging in, choose the Match One Geography to Another option so that you can assign
grid coordinates to school postcode. Click Next to continue. In the Source Geographies page, select
Postcode and then click Next. Choose Lower Layer Super Output Area (England and Wales) as the Target
Geographies and then click Next to proceed. Choose an appropriate geography lookup list when prompted.
This will then take you to the metadata setting and input file upload page. Click on Metadata Display
and select all the data fields that are relevant to your work. For this exercise, you should at least
include National Grid-Reference Easting and National Grid-Reference Northing. Click on Upload File and
make sure the column delimiter is set to comma and the first row of the file is a title row. Click
Browse to navigate to upload the csv file. Follow the on screen instructions until the results are
generated. Click on the Matched Rows link to save the results. The file will have postcode and the data
fields of your choices i.e. the grid references.
To be able to map school performance data, you will need to link the original csv file and the one
produced by GeoConvert. Provided that there are no unmatched rows of data, you can simply copy the
content of one file and paste it into the other file in Microsoft Excel. For a more rigorous linkage,
you should consider matching the files using Microsoft Access. It is good practice to save the file in a
different name to reflect the new content. To ensure that the file can work in ArcGIS, you will need to
open (or import via File > Get External Data > Import) the "linked" file in Microsoft Access.
Check the values and data types of all the fields and make any necessary adjustment before exporting the
data in dBASE IV format (.dbf).
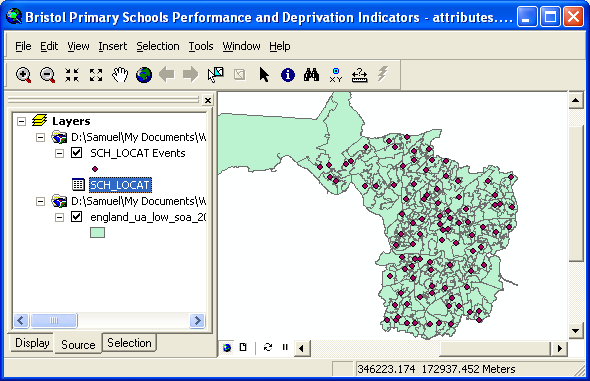
3. Map the schools location in ArcGIS
One exercise which you could undertake is to map the location of the schools as a set of points
(represented by their postcodes). To do this, import the database (dbf) file into ArcGIS as a table.
Right click on the table in the Table of Contents and then select Display XY data. Specify the relevant
table and then the fields to be used for the X and Y fields. Specify a map projection and then click on
OK. The location of the postcodes relating to the schools will now be mapped as shown below. For
orientation purposes, if you previously downloaded lower level super output area (LSOA) boundaries in
another exercise, you could map these together with the school postcode locations. To do this,
click Add Data and select the relevant shapefile containing the LSOA boundaries. You can change
the ordering of the shapefiles (to control which layer overlays which) by dragging and dropping the
relevant shapefiles in the Table of Contents; by default, the latest layer to be added is displayed on
top of any other layers.
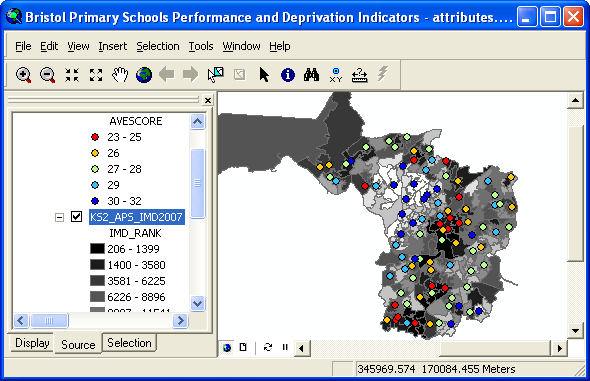
4. School performance and deprivation mapping in ArcGIS
To map other attribute data such as the average KS2 scores other than the location of the schools,
right-click on the shapefile layer (the one with the word "Events" at the end) in the Table of
Contents and then select Properties. In the dialog box, select Symbology. You will most likely wish to
create either a map for continuous data (select Quantities) or categorical data (select Categories). You
can then experiment with different colour schemes, classification schemes, etc. Finally, you may wish to
create a Map Document which you could then either print or export in digital format for use in another
software package such as Microsoft Word or Powerpoint.
If you have created a map showing the deprivation data of the lower layer super output areas in Bristol
from another exercise, you may want to overlay it with the school performance data. Provided that the
deprivation data has already been saved in a separate shapefile, the data can be added as a new map
layer by clicking Add Data and selecting the relevant shapefile containing the LSOA boundaries.
Otherwise, you will need to join the deprivation data to the LSOA boundaries and then map them. To do
that, add the table containing the deprivation data to the map. The table of deprivation data should
have been created in the deprivation mapping exercise and stored as a dbf file. Join the attribute data
to the shapefile layer (by right-clicking on the shapefile layer's name in the Table of Contents and
selecting Join). Indicate that you wish to join attribute data from a table and select the relevant
field from the layer on which the join should be based (i.e. zonecode). Then select the relevant table
which you wish to join to the layer (i.e. your deprivation data) and the field on which to base the join
(in this case, LSOA_code). Click OK and your data will be joined to the layer. You can make the join
permanent by exporting the shapefile layer to another shapefile layer: right-click on the layer's name,
select Data > Export Data, provide a location and name for the new shapefile and then click OK. Add
the new shapefile to the map when prompted and adjust its Symbology property accordingly. The resulted
map should now show the school performance data (e.g. average point scores at KS2) superimposed onto the
deprivation map of the lower layer super output areas in Bristol as below.
Copyright Attribution
ArcGIS® is a registered trademark of Environmental Systems Research Institute, Inc. (ESRI). dBASE is
a registered trademark of dBASE Inc and Access™, Excel®, PowerPoint® and Word® are
registered trademarks of Microsoft Corporation. The software screen shots shown in this page are
reprinted with permission from ESRI. The maps shown above are based on data provided through EDINA
UKBORDERS with the support of the ESRC and JISC and uses boundary material which is copyright of the
Crown.
 Homepage