 Homepage
 1. Download 2007 Index of Multiple Deprivation data
Using an Internet browser, go to the Neighbourhood Statistics website at http://neighbourhood.statistics.gov.uk. Click on view or download data by topic (The I WANT TO: pane in the bottom left of the screen). Select Indices of Deprivation and Classification and then select the Indices of Deprivation 2007 for Super Output Areas. Click Next and choose to download the file in comma delimited .csv format and save it to an appropriate location.
2. Check, clean and edit the data
The deprivation data which you have just downloaded are termed attribute data. It is good practice to check, clean and edit any downloaded attribute data before attempting to link or map it. Import these attribute data into Microsoft Excel. Check that the fields all look sensible, name any fields where relevant and delete any unnecessary fields or rows. The key fields which you will need are: the LSOA code, LSOA name, Index of multiple deprivation (Score) and Index of multiple deprivation (Rank) and any other data or codes which you think might be useful or interesting. You will need to remove the title/header information and probably shorten the fieldnames (a maximum length of 8 characters is usually recommended to ensure successful transfer between different software packages). Also, as you only want to map data for the City of Bristol you should discard the rows containing data for any other Unitary Authorities/Local Authority Districts/Counties. When you have finished, save the file and import it into Microsoft Access (File > Get External Data > Import). Once again, check the values and data types of all the fields and make any necessary adjustment before exporting the data in dBASE IV format (.dbf).
3. Download digital boundary data from UKBORDERS
Navigate to the UKBORDERS website at http://edina.ac.uk/ukborders/. Login and select Boundary data selector. Then select the relevant Country (England), Geography (Census boundaries) and Dates (post 1999). Click Find and then select the relevant areas from the resultant list (in this case, as Bristol is a Unitary Authority, you will need to select English Unitary Authority Super Output Areas (Lower Layer) 2001) and click on List Areas. Select Bristol, City of UA from the list and then click Extract Boundary Data. When the extraction has completed, save the downloaded file to an appropriate location. You will probably need to unzip the file before using it.
4. Joining attribute data to boundary data in ArcGIS
You can now import the attribute and boundary data into ArcGIS and then join the attributes to the boundaries. Add the shapefile containing the Bristol SOAs as a layer to the map. Then add the table containing the deprivation data to the map as well. Join the attribute data to the shapefile layer (by right-clicking on the shapefile layer's name in the Table of Contents and selecting Join). Indicate that you wish to join data from a table and select the relevant field from the layer on which the join should be based (i.e. zonecode). Then select the relevant table which you wish to join to the layer (i.e. your deprivation data) and the field on which to base the join (in this case, LSOA_code). Click OK and your data will be joined to the layer. You can make the join permanent by exporting the shapefile layer to another shapefile layer: right-click on the layer's name, select Data > Export Data, provide a location and name for the new shapefile and then click OK. Add the new shapefile to the map when prompted.
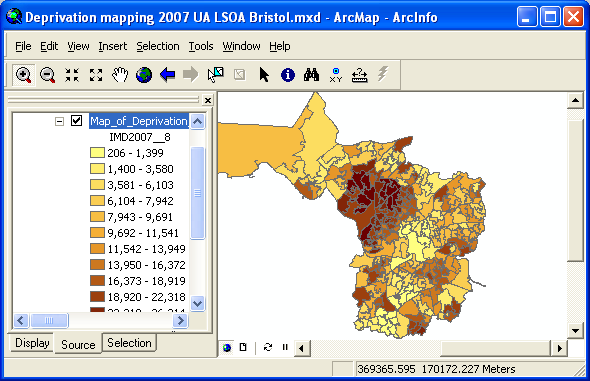
5. Creating a choropleth map
You can now go ahead and explore the deprivation data. Try creating various choropleth maps of the variables, e.g. the Rank of Index of Multiple Deprivation Score as in the figure below. To do that, right-click on the layer's name in the Table of Contents and then select Properties. In the dialog box, select Symbology. You will most likely wish to create either a map for continuous data (select Quantities) or categorical data (select Categories). You can then experiment with different colour schemes, classification schemes, etc. Finally, you may wish to create a Map Document which you could then either print or export in digital format for use in another software package such as Microsoft Word or PowerPoint.
Copyright Attribution
ArcGIS® is a registered trademark of Environmental Systems Research Institute, Inc. (ESRI). Access™, Excel®, PowerPoint® and Word® are registered trademarks of Microsoft Corporation and dBASE is a registered trademark of dBASE Inc. The software screen shots shown in this page are reprinted with permission from ESRI. The maps shown above are based on data provided through EDINA UKBORDERS with the support of the ESRC and JISC and uses boundary material which is copyright of the Crown.