-
- Mod 5 - Ord Reg
- 5.1 Introduction
- 5.2 Ordinal Outcomes
- 5.3 Assumptions
- 5.4 Example 1 - Ordinal Regression on SPSS
- 5.5 Teacher Expectations and Tiering
- 5.6 Example 2 - Ordinal Regression for Tiering
- 5.7 Example 3 - Interaction Effects
- 5.8 Example 4 - Including Prior Attainment
- 5.9 Proportional Odds Assumption
- 5.10 Reporting the Results
- 5.11 Conclusions
- 5.12 Other Categorical Models
- Quiz
- Exercise
- References
- Mod 5 - Ord Reg
Using Statistical Regression Methods in Education Research

5.8 Example 4 - Including a Control for Prior Attainment
|
A key variable so far missing from our model is information on students’ prior attainment. This is important since we would expect that students with lower attainment would be entered for the lower tiers and those with higher attainment would be entered for higher tiers. Fortunately we have a measure of students’ prior attainment in the form of their average score in national tests at age 11, so we can add this to the model. As we said earlier, to aid the interpretation of a continuous explanatory variable we need to make the zero value meaningful. For this reason the (by now quite familiar!) standardised measure of attainment at age 11 (ks2stand) is most useful because zero indicates the mean age 11 score, so our model coefficients will be calculated for students of average prior attainment. We also know the SD for ks2stand is 10, which is a nice round number should we want to calculate the coefficient for students 1 SD below or 1 SD above the mean. So now run the previous model (with Ethnic2, gender and sec2) but also add ks2stand. This should be added to the covariates box because it is a continuous explanatory variable.
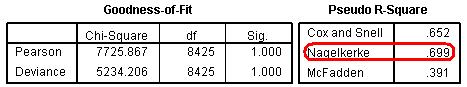
Let’s take a look at Figure 5.8.1. The goodness of fit test is now no longer significant, which suggests the model fits the data well. However as we said earlier we should probably not pay too much attention to this because with a continuous predictor (age 11 standard score) there are many empty cells. In fact whereas before we had 20 (3.9%) empty cells now SPSS issues a warning message telling us we have 7086 (62.9%) empty cells. This warning does not mean we cannot proceed with the analysis, but it does mean we should be wary of the accuracy of the goodness-of-fit test. Figure 5.8.1: Statistics for Evaluating the Prior Attainment Model We can inspect the Pseudo- R2 to get an alternative indication of the predictive power of the model. Our Pseudo-R2 value has increased hugely (from 12.7% to 69.9%) so the model is much better able to predict the outcome for individual cases. This improvement in R2 is in line with that we have seen previously when we add prior attainment to our prediction of achievement (see Page 3.13
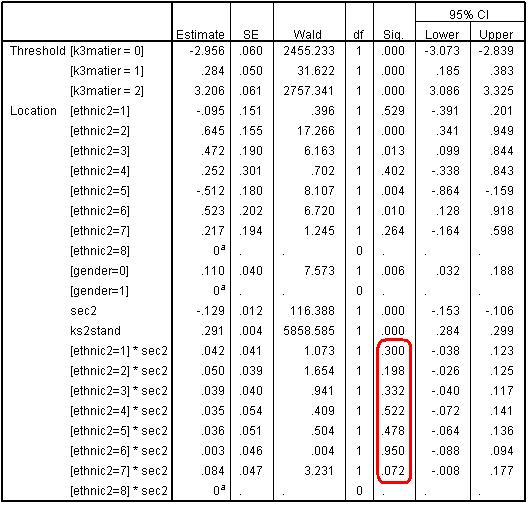
Looking at the parameter estimates table below (Figure 5.8.2), none of the terms for the interaction between ethnic2*sec2 remain statistically significant in our new model, so the interaction terms can be dropped to simplify the model. Figure 5.8.2: Parameter Estimates for Prior Attainment Model with interaction term
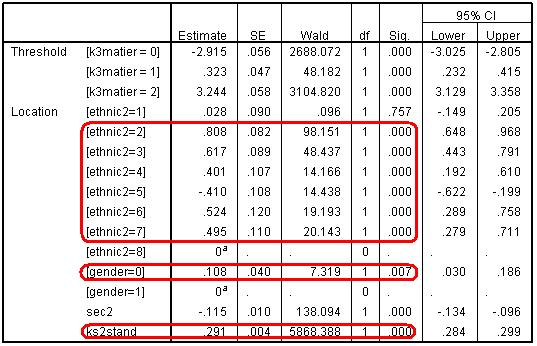
Below is the parameter estimates table from a model run after we have dropped the ethnic2*sec2 interaction terms (Figure 5.8.3). Figure 5.8.3: Parameter estimates after dropping the ethnic2*sec2 interactions
Clearly prior attainment has accounted for a large proportion of the variance in tier entry. A unit change in KS2 standard score increase the odds of entry to the higher tier by exp(.291) = 1.34. The SD of ks2stand is 10 and Exp(.291*10)= 18.4, so a student scoring 1 SD above the mean score at age 11 is 18 times more likely to be entered for a higher tier than a student with the average (mean) age 11 score. Equally a student with an age 11 score 1 SD below the mean is 18 times less likely to be entered for a higher tier than a student with the mean age 11 score. However there are still significant association with ethnic group, SEC and gender. Boys (gender=0) are significantly more likely to be entered for the higher tier, even after prior attainment, SEC and ethnicity are controlled: Exp(.108)=1.11, p<.007. Students from lower SEC are still less likely to be entered for the higher tiers, even after control for prior attainment, ethnic group and gender: Exp(-.115)=0.89, p<.005. In relation to ethnic group there are mixed results. Students from Indian (ethnic2= 2), Pakistani (ethnic2= 3), Bangladeshi (ethnic2= 4), Black African (ethnic2= 6) and Any other ethnic group (ethnic2= 7) are significantly more likely to be entered to higher tiers than comparable White British students. For example Pakistani students are Exp(.617)=1.85 times as likely as similar White British students to be entered to higher tiers. However Black Caribbean (ethnic2= 5) students are distinctive as the only ethnic group to be less likely to be entered to higher tiers than White British students (Exp(-.410)=0.66, p<.005). Even after control for prior attainment, SEC and gender, the odds of Black Caribbean students being entered for the higher tiers are about two-thirds of the odds for White British students. Put the other way round the odds for White British students of being entered are (1/.66)=1.5 times or 50% greater than the odds for Black Caribbean students of the same prior attainment, SEC and gender.
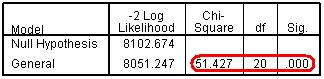
However the test of parallel lines (Figure 5.8.4) still indicates that the PO assumption may not hold for the data, with the ‘p<.000’ indicating rejection of the null hypothesis of PO. Figure 5.8.4: Test of Parallel Lines after dropping the ethnic2*sec2 interactions This indicates that there may be some explanatory variables for which the ORs are not stable across different cumulative thresholds in relation to tier of entry. We therefore need to delve into this a bit deeper. |