-
Odds ratio
When used in logistic regression the Odds Ratio (OR) tells us how much the odds an outcome occuring increase (or decrease) when there is a unit change in the associated explanatory variable.
A OR of '1' corresponds to no change in the odds after a change of one unit in the predictor, a value of '2' means the odds of the outcome occuring are twice as high and a value of '0.2' means the odds decrease by four-fifths (or 80%).
This can be very useful when comparing categories within nominal/ordinal predictor variables. For example, it could be used to ascertain how much more or less likely a certain ethnic minority group are to study mathematics compared to White British students (the reference group).
The odds ratio is labelled as Exp(B) on SPSS.
-
Ordinal
Ordinal variables are categorical but unlike nominal data the categories can be placed into a rank order of magnitude. For example, data that was recorded on a five-point scale that ranges between strongly disagree and strongly agree would be considered ordinal. It is important to note that while ordinal responses can be ranked the distances between each rank are not necessarily equal. Ordinal data cannot be measures on a scale like continuous data.
-
Ordinal regression
Ordinal regression is basically a version of multiple regression where the outcome variable is ordinal, meaning there are three or more possible outcomes and that these can be arranged hierarchically (e.g. National Curriculum levels or Socio-economic status). The model can be used to calculate the probability of a case/observation falling into each of the ordinal outcome categories given a set of explanatory variables. Ordinal regression is the topic of Module 5 .
.
-
Outcome variable
An outcome variable, sometimes called a dependent variable, is the variable that you are trying to predict using a regression analysis. Data from one or more explanatory variables are used to predict the outcome. Like explanatory variables, outcome variables can be anything that the researcher wishes to explore as long as it is sensibly and reliably quantified.
-
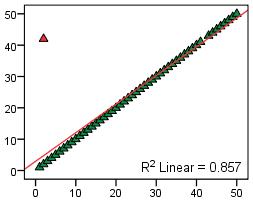
Outlier
An outlier is a data point or case that does not conform to the general pattern of the data. Outliers can bias statistical analysis and lead to erroneous conclusions being drawn and so it is important that they are identified and either removed or explored in more detail (or both!). The scatterplot below shows how a single outlier can influence a regression model.