-
- Mod 5 - Ord Reg
- 5.1 Introduction
- 5.2 Ordinal Outcomes
- 5.3 Assumptions
- 5.4 Example 1 - Ordinal Regression on SPSS
- 5.5 Teacher Expectations and Tiering
- 5.6 Example 2 - Ordinal Regression for Tiering
- 5.7 Example 3 - Interaction Effects
- 5.8 Example 4 - Including Prior Attainment
- 5.9 Proportional Odds Assumption
- 5.10 Reporting the Results
- 5.11 Conclusions
- 5.12 Other Categorical Models
- Quiz
- Exercise
- References
- Mod 5 - Ord Reg
Using Statistical Regression Methods in Education Research

5.3 Key Assumptions of Ordinal Regression
|
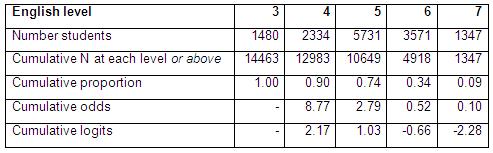
What do we mean by the assumption of proportional odds (PO)? To explain this we need to think about the cumulative odds. Figure 5.3.1 takes the data from Figure 5.1.1 to show the number of students at each NC English level, the cumulative number of students achieving each level or above and the cumulative proportion. Remember proportions are just the % divided by 100. We can see that the proportion achieving level 7 is 0.09 (or 9%), the proportion achieving level 6 or above is 0.34 (34%) and so on. From this we can calculate the cumulative odds of achieving each level or above (if you require a reminder on odds and exponents why not check out Page 4.2 Table 5.3.1: Cumulative odds for English level
In the table we have also shown the cumulative log-odds (logits), this is just the natural log of the cumulative odds which you can calculate in EXCEL or on a scientific calculator. Log odds rather than odds are used in ordinal regression for the same reason as in logistic regression (i.e. they do not suffer from the ceiling and floor effects that odds do, you should remember this from Module 4
If you want to use the LOG function in EXCEL to find the logit for the odds remember you need to explicitly define the base as the natural log (approx. 2.718) e.g. =LOG(odds,2.718).
The key assumption in ordinal regression is that the effects of any explanatory variables are consistent or proportional across the different thresholds, hence this is usually termed the assumption of proportional odds (SPSS calls this the assumption of parallel lines but it’s the same thing). This assumes that the explanatory variables have the same effect on the odds regardless of the threshold. For example if a set of separate binary logistic regressions were fitted to the data, a common odds ratio for an explanatory variable would be observed across all the regressions. In ordinal regression there will be separate intercept terms at each threshold, but a single odds ratio (OR) for the effect of each explanatory variable. This is best explained by an example.
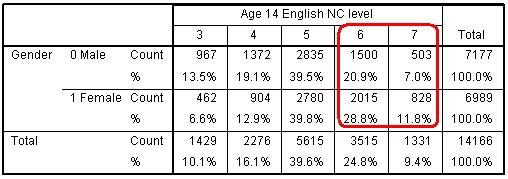
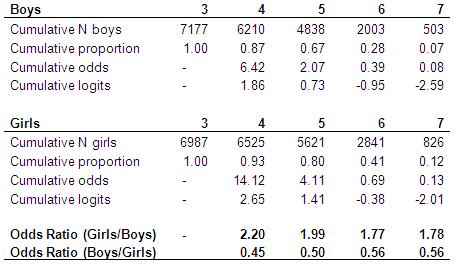
As a simple example let’s start by just considering gender as an explanatory variable. Before you start building your model you should always examine your ‘raw’ data. Figure 5.3.2 shows the cross tabulation of English level by gender. Figure 5.3.2: Gender by English level crosstabulation Clearly girls tend to achieve higher outcome levels in English than boys. What does this look like in terms of the cumulative proportions and cumulative odds? In Figure 5.3.3 we calculate the cumulative odds separately for boys and for girls. Figure 5.3.3: Cumulative odds for English NC level separately for boys and girls We can calculate odds ratios by dividing the odds for girls by the odds for boys. In general the odds for girls are always higher than the odds for boys, as proportionately more girls achieve the higher levels than do boys. These odds ratios do vary slightly at the different category thresholds, but if these ratios do not differ significantly then we can summarise the relationship between gender and English level in a single odds ratio and therefore justify the use of an ordinal (proportional odds) regression. If we do calculate the odds ratio from an ordinal regression model (as we will do below) this gives us an OR of 0.53 (boys/girls) or equivalently 1.88 (girls/boys), which is not far from the average across the four thresholds. This assumes the odds for girls of achieving level 4+ are 1.88 greater than the odds for boys; the odds of girls achieving level 5+ are 1.88 times greater than the odds for boys, and so on for level 6+ and level 7... i.e. that the odds of success for girls are almost twice the odds of success for boys, wherever you split the cumulative distribution (that is to say, whatever threshold you are considering). SPSS has a statistical test to evaluate the plausibility of this assumption, which we discuss on the next page (Page 5.4 |