-
- Mod 3 - Multiple Reg
- 3.1 Overview
- 3.2 The Model
- 3.3 Assumptions
- 3.4 Modelling LSYPE Data
- 3.5 Model 1: Ordinal Explanatory Variables
- 3.6 Model 2: Dichotomous Explanatory Variables
- 3.7 Model 3: Nominal Variables
- 3.8 Predicting Scores
- 3.9 Model 4: Refining the Model
- 3.10 Comparing Coefficients
- 3.11 Model 5: Interaction Effects 1
- 3.12 Model 6: Interaction Effects 2
- 3.13 Model 7: Value Added Model
- 3.14 Diagnostics and Assumptions
- 3.15 Reporting Results
- Quiz
- Exercise
- Mod 3 - Multiple Reg
Using Statistical Regression Methods in Education Research

3.13 A Value Added Model (Model 7)
|
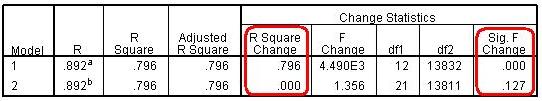
In all the models we have computed so far we have not included the variable which we saw in the SLR module had the biggest impact on age 14 score, namely test score at age 11. We now will include age 11 test score in our model. We should note that adding this variable changes the conceptual nature of our outcome. By evaluating attainment at age 14, after the variance associated with attainment at age 11 has been taken into account, we are effectively evaluating progress between age 11 and age 14. Positive residuals will indicate students making greater than average progress age 11 to age 14, while negative residuals will indicate pupil making less than the average progress between age 11 and 14. So let’s run Model 6 again, but this time also include age 11 score as a explanatory variable. Additionally, so that we can test whether our interaction terms give a statistically significant increase in r2 or not, we will enter the variables in two separate blocks and calculate the r2 change, as we did on Page 3.11 The figure below shows the model summary (Figure 3.13.1). The r2 increase massively from 17.0% in Model 6 up to 79.6% in this model. This testifies to the power of prior attainment as a predictive factor. By knowing how well a student was achieving at age 11, we can explain nearly 80% of the variance in how well they achieve at age 14. It is notable though that the ethnic by SEC interaction terms do not Increase r2 significantly. Comparing the main effects model with the interaction model we see that there is no evidence that the inclusion of the interaction terms raises the r2 of the model (‘Sig. F Change’, p = .127). The model explains 79.6% of the variance in age 14 scores with or without the interaction effects. Figure 3.13.1: Model summary when including prior attainment
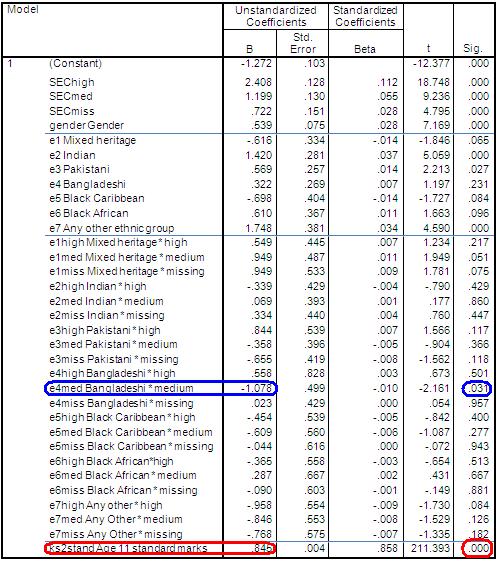
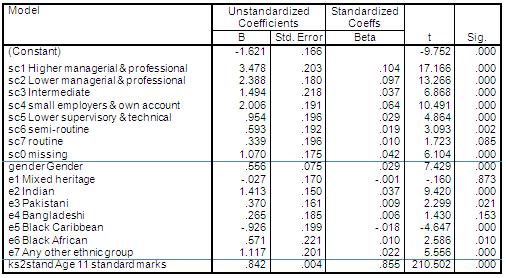
Figure 3.13.2 presents the regression output. While age 11 score is the most powerful explanatory variable in the model (look at the Beta values to get a relative idea) it is not the only significant one. SEC still has a significant association with student progress. White British students from medium SEC homes make 1.2 points greater progress than students of the same prior attainment from low SEC homes, and White British students from high SEC homes make 2.5 points more progress than students with the same age 11 scores from low SEC homes. Gender is also still highly significant, with girls making 0.54 points more progress than boys after control for prior attainment and SEC. Remember that these are effects on student progress. They therefore indicate that social class and gender gaps increase between age 11 and age 14, that is the gaps get wider. Figure 3.13.2: Coefficients output (Model 7) Why are the interaction terms no longer significant? The results indicate that some of the ethnic by SEC interactions at age 14 reflect differences in prior attainment at age 11 (not included in earlier models). For example Black Caribbean high SEC students tend to have lower scores at age 11 than White British high SEC students, and this is one reason the age 14 attainment of Black Caribbean high SEC students may have been lower than their White British high SEC peers. Once we take this factor into account the interaction terms are no longer significant. The only exception is Bangladeshi * Medium SEC (p=.031). This may have emerged as statistically significant at the .05 confidence level due to the fact that multiple pairwise comparisons (t-tests) were made. At the .05 level you can expect 1 in 20 pairwise comparisons to emerge as statistically significance by chance alone! We have arrived at the final model for our regression analysis. HOORAY! Given the interaction terms are not significant, we revert to the eight class SEC variable we used earlier, treated as a set of dummy variables. Our final model (Model 7) is: ks3stand (Dependent), sc0-sc7, gender, e1-e7 and ks2stand. The r2 value of this model is 79.6%, and the coefficients table is presented below. Figure 3.13.3: Final regression model
The next step is to test the adequacy of the model specification and whether the assumptions of multiple regression analysis, as outlined on Page 3.3 |