-
LSYPE
LSYPE stands for the Longitudinal Study of Young People in England. It is a large scale and innovative study of young people which brings together data from a number of different sources, including administrative data from schools and annual interviews with young people and their parents. The data set used for the examples and
exercises on this website encompass over 15,000 participants and provides an incredibly rich and varied source for researchers. In fact this data set constitutes only a small proportion of the full range of material available from LSYPE! More details are available from the LSYPE Economic
and Social Data Service (ESDS) page .
.
-
Latent Variable
A latent variable cannot be observed directly but is related to several other variables that can be measured. These related measures can be drawn together to create a value which represents the latent variable.
For example, personality traits such as 'extraversion' are difficult to measure directly but multiple measures of behaviour or attitude can be brought together to try to ascertain where an individual may be on a scale of extraversion.
-
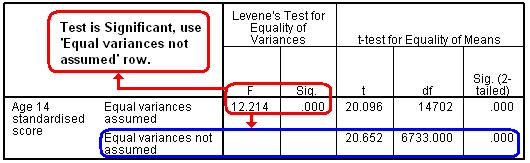
Levenes Test
This tests the hypothesis that the variances in different groups are equal (that the assumption of homogeneity of variance has not been violated). A statistically significant result indicates that the variances are different and that there is a problem with the assumption.
Levene's Test is associated with the T-test and SPSS kindly provides an alternative T-statistic for when equal variances are not to be assumed (e.g. Levene's Test is statistically significant and the assumption of homogeneity of variance can not be met). We show the output below:
-
Linear model
A linear model (you will often come across the phrase simple linear model) refers to any statistical model that is based on linear relationships between explanatory variables and an outcome. All the regression models discused in the website are based on linear modelling.
-
Log-likelihood
Analogous to the Sum of Squares in Multiple regression, the -2 log-likelihood (-2LL) provides us with an indication of the total error that is in a logistic regression model. The larger the value of the -2LL the less accurate the predictions of the model are. See MLR module 4.6.
-
Logistic Regression
In simple terms the logistic regression is a version of multiple regression where the outcome variable is binary (dichotomous), meaning there are only two possible outcomes. The model can be used to calculate the probability of one of the two outcomes occurring over the other for a given case/observation by using the values of a
set of
known explanatory variables. Logistic regression is the topic of module 4.
-
Logit
This glossary entry refers to a binary logit, the type used in logistic regression. Without getting too technical Logits are basically transformations of existing binary outcome variable data points into a probability P (ranging from 0 to 1). A logit curve is therefore a graph of
these logits plotted
against an explanatory variable.

