-
- Mod 4 - Log Reg
- 4.1 Overview
- 4.2 Odds, Odds Ratios and Exponents
- Quiz A
- 4.3 A General Model
- 4.4 Log Reg Model
- 4.5 Logistic Equations
- 4.6 How good is the model?
- 4.7 Multiple Explanatory Variables
- 4.8 Methods of Log Reg
- 4.9 Assumptions
- 4.10 Example from LSYPE
- 4.11 Log Reg on SPSS
- 4.12 SPSS Log Reg Output
- 4.13 Interaction Effects
- 4.14 Model Diagnostics
- 4.15 Reporting the Results
- Quiz B
- Exercise
- Mod 4 - Log Reg
Using Statistical Regression Methods in Education Research

Logistic Regression Module Exercise
|
We have seen that prior attainment, specifically age 11 test score, is a strong predictor of later achievement. Maybe some of the ethnic, social class and gender differences in achievement at age 16 reflect differences that were already apparent in attainment at age 11? This would have substantive implications for education policy, because it would indicate that attention would need to focus as much on what has happened during the primary school years up to age 11 as on the effects of education during the secondary school years up to age 16. Use the LSYPE 15,000 dataset Note: The variable names as they appear in the SPSS dataset are listed in italics. We have also included some hints in italics.
Exam score at age 11 is included in the LSYPE dataset as ks2stand. Before we include it in our model we need to know how it is related to our outcome variable, fiveem. Graphically show the relationship between ks2stand and fiveem. Use a bar chart.
In this module we have established that ethnicity, socio-economic class and gender are all significant predictors of whether or not students pass 5 or more GCSE exams with grades A*-C at age 16 (our trusty fiveem). Does age 11 score (ks2stand), when added alongside ethnic group, SEC and gender, make a statistically significant contribution to predicting fiveem? Run a logistic regression model with these variables: Outcome: fiveem; Explanatory: ethnic, SECshort, gender, ks2stand Remember that ethnic, gender and SECshort are categorical variables and you need to use the ‘Categorical’ button to set the reference category. You should set this to ‘First’ for ethnic which will select the lowest value as the reference category (0=White British), to ‘First’ for gender (0=boy) and to ‘Last’ for SECshort which will select the highest category as the reference group (3=low SEC)
To what extent does adding age 11 score as an explanatory variable improve the fit of the model? That is to say, by how much does it improve how accurately the model predicts whether or not students achieve fiveem? Run the analysis again but this time with two blocks, including ethnic, SECshort and gender in the first block and ks2stand in the second. Examine the -2LL and pseudo-R2 statistics.
Following on from question 3, what difference (if any) does adding age 11 score to the model make to the ethnic, gender and SEC coefficients? What is your interpretation of this result? No need to carry out further analysis – just examine the ‘Variables in the equation’ tables for each block. Is there an interaction effect between Social Class and age 11 score? Run the model again but this time including a SECshort*ks2stand interaction. You may also wish to graph the relationship between age 11 exam score and SEC in the context of fiveem. Are there any overly influential cases in this model? You will need to get the Cook’s distances for each case. This may require you to re-run the model with different option selections.
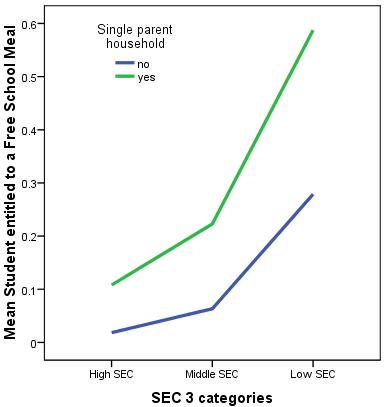
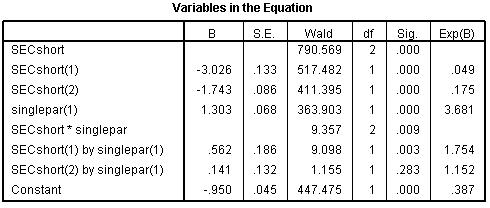
Something slightly different now... A Logistic regression model that predicts whether or not a student is eligible for free school meals (fsm) is created. Socio-economic Class (SECshort), and whether the family is single parent (singlepar) are used as explanatory variables and SECshort*singlepar is included as an interaction term. The line graph below shows this interaction and we also include the ‘Variables in the Equation’ table.
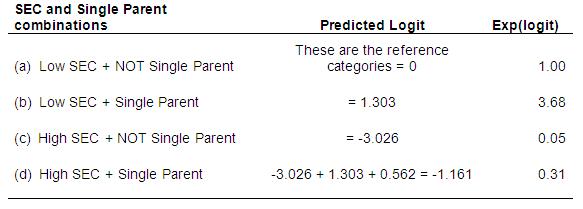
Using the all important ‘Variables in the Equation’ table (above) we can calculate the predicted logit of being eligible for a FSM for the four combinations of High/Low SEC and Single parent/Dual parent status, and the odds are the exponent of the logit. a) Is the SECshort*singlepar interaction statistically significant? b) What is the OR for the increase in the odds of eligibility for FSM for single parent vs. dual parent families from low SEC homes? c) What is the OR for the increase in the odds of eligibility for FSM for single parent vs. dual parent families from high SEC homes? d) What is the ratio of these two ORs? You do not need to perform any additional analysis – just use the information we have provided!
When you are ready you can check your answers here |