Using Statistical Regression Methods in Education Research

Module 5 Exercise Answers
|
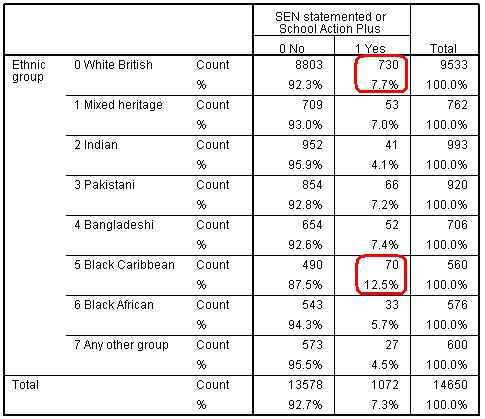
Explore the relationship between ethnic group (ethnic2) and a) having an identified Special Educational Need (sen), b) whether the student reported truanting at any time during year 9 (truancy) and c) whether the student has been excluded from school at any point during Years 7 and 9 (exclude). What are the differences between Black Caribbean and White British students on these variables? Are any differences statistically significant? The following cross-tabulations were created using the Analyze>Descriptive Statistics>Crosstabs option on SPSS. We have also included the row percentages and Pearson’s Chi-square
for each crosstab (the results of which are reported above each table). If you are unsure about how to do this we describe the process on Page 2.2
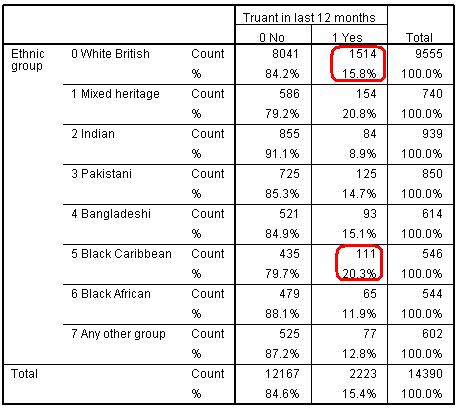
Ethnicity by SEN crosstab Chi-square = 48.03, df = 7, p <.0005. Ethnicity by Truancy crosstab Chi-square = 66.56, df = 7, p <.0005.
Ethnicity by Exclusion crosstab Chi-square = 121.85, df = 7, p <.0005.
The results indicate that there are statistically significant associations between ethnicity and each of SEN, truancy and exclusion – in short that there are significant differences between ethnic groups with regard to these three variables. Let us explore the specific comparison between White British and Black Caribbean students more closely. We can see that Black Caribbean students are more likely to be identified as having special educational needs (12.5%) than White British students (7.7%). They are also more likely to report truanting (20.3% of students) compared to White British students (15.8%). Finally they are nearly twice as likely to be excluded as White British students with 20% having been excluded compared to only 10.4% of White British students. There seem to be grounds to include all three of these explanatory variables in any model which attempts to account for ethnic differences in entry to different test tiers.
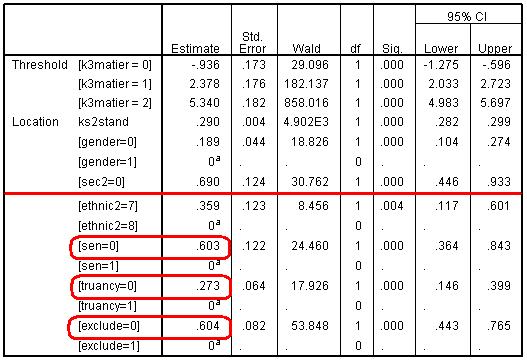
Complete an ordinal regression similar to the one we have used as an example throughout this module but entering the variables SEN, truancy and exclude along with the factors (ethnic2, gender and sec2) and the covariate (ks2stand). Are SEN, truancy and exclude related to the likelihood of a student being entered to a higher mathematics tier? What are the odds ratios for these three new variables? An Ordinal Regression was completed using the model as shown in Figure 5.8.3 but with the addition of the SEN, truant and exclusion variable. The key output from the parameter encoding table is shown below: Parameter Estimates Table Let’s look at the coefficients for our three new explanatory variables (sen, truancy and exclude). To make sense of these logits we will need to take the exponentials to turn them into odds ratios (ORs). This is where EXCEL or a graphics calculator comes in handy! So:
In SPSS ordinal regression the reference category for nominal explanatory variables is indicated by the value 1, and for all three variable the value ‘1’ indicates ‘yes’. The fact that the ORs are greater than 1 tells us that students who do not have SEN, who do not report truanting and who have never been excluded from school are more likely to be entered for the higher tiers. Those who do not have an identified SEN are nearly twice (1.83 times) as likely to be entered for a higher tier as those with SEN. Similarly the odds of students who have never been excluded from school being entered to a higher tier are 1.83 higher than the odds for students who have been excluded. Finally there is a less pronounced but still highly significant association with truancy: students who did not report truanting were 1.31 times more likely to be entered for a higher tier than those who did report truanting. Remember that these associations are significant even after differences in prior attainment, ethnicity, gender and socio-economic class of the home are accounted for.
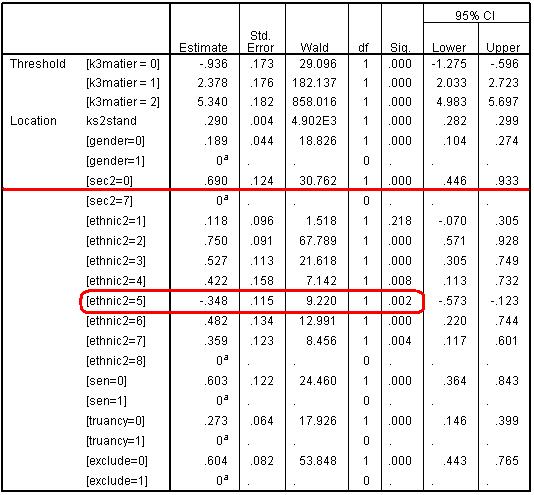
Does the addition of these new variables change the ethnic Odds Ratios substantially compared to Figure 5.8.3 (Page 5.3 )? Are Black Caribbean students still under-represented relative to White British students in entry to the higher maths tiers? In the original model - before we entered SEN, exclude and truancy (see Figure 5.8.3) - the logit for Black Caribbean students was -.410, and the exponent of this indicates an odds ratio of 0.66. In this original model then Black Caribbean students were roughly two-thirds as likely as White British students to be entered for the highest tier. In our new model (see table below) we can see that the logit for Black Caribbean students (ethnic2=5) is -.348 which is an odds ratio of Exp (-.189) = 0.71. Thus the under-representation of Black Caribbean students is very slightly reduced, but not by much. The statistical significance of the coefficient for Black Caribbean is still very high (p<.0005). So even after accounting for the higher likelihood of Black Caribbean students to have SEN, to truant or to be excluded from school, Black Caribbean students are still roughly two-thirds as likely as comparable White British students to be entered for a higher tier. Parameter Estimates
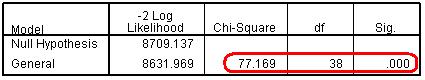
It is worth noting that the test of parallel lines for the model is significant, so strictly speaking the proportional odds assumption is rejected, although we should remember the anti-conservative nature of this test. Test of Parallel Lines
For completeness you might want to undertake separate binary logistic
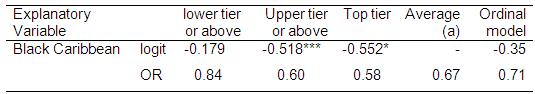
regressions for TierTop, TierUpper and TierLower as was demonstrated on Page 5.9 Coefficient for Black Caribbean in three separate binary logistic regressions for a model including SEN, truancy and school exclusion as well as prior attainment, ethnicity, gender and SEC
Notes: (a) is the average value across the three logistic models. *=p<.05, **=p<.005. You will see that with the inclusion of SEN, truancy and exclude the under-representation of Black Caribbean students in entry to the lower tier or above compared to the bottom tier (0.84) is no longer statistically significant. However the under-representation of Black Caribbean students in entry to the upper tier and above (0.60), and to the top tier (0.58), are large and statistically significant. As a result the cumulative OR from the ordinal model (0.71) is a somewhat less robust summary than was previously the case (see discussion on Page 5.9 |