Using Statistical Regression Methods in Education Research

Extension A Exercise Answer
|
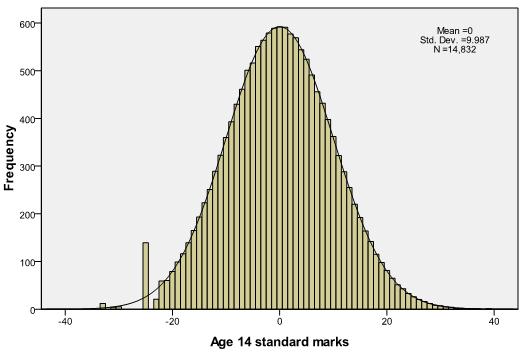
Following the process outlined in this section you should find your ks3stand distribution looks like the one below:
As you can see it is now much more in line with a normal distribution (perhaps more so when compared to the age 11 scores). The only discrepancy remains with the floor effect at approximately ‘-25’. |