-
SPSS/PASW
SPSS (Statistical Package for the Social Sciences) is a computer program designed to organize and analyse quantitative data. It allows users to perform a vast number of statistical analyses and includes a substantial tool set for regression analyses. It is the most widely used statistical package in the social science. SPSS was temporarily
rebranded PASW (Predictive Analytics SoftWare), presumably just to confuse everyone, but is now referred to as IBM SPSS.
-
Sample
A sample is a selection of cases drawn from a population and used to make inferences about that population. Samples can be drawn in a number of ways but must be representative of the population to achieve reliable and valid results (random selection of units is the best way to achieve a representative sample).
-
Sampling Distribution
If we were to take multiple samples of a given size from a population and then calculate a statistic for each sample (e.g. the mean) we would find that these values differed somewhat due to random variation between the samples (sampling error). If we drew enough samples our values could be plotted as a frequency distribution
-
this is our sampling distribution. It is the distribution of the possible values we could get when drawing a sample of a given size from the population.
-
Sampling Error
Essentially this is the error caused by observing a sample rather than the entire population of interest. This is non-systematic error - the effect is random, assuming of course that the sample was chosen at random from the population.
-
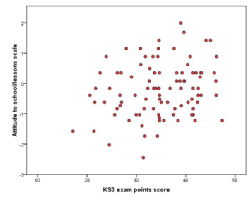
Scatterplot
A scatterplot is a graph that plots the values of one variable against the corresponding values of another. A variable is assigned to each axis of the graph and each 'dot' represents one participant. Scatterplots can be build for three variables if a Z-axis is included along with the X and Y axis. This is commonly called a 3D scatterplot.
An
example of each is included below:
| Scatterplot |
3D Scatterplot |
 |
 |
-
Simple linear Regression
A simple linear model in which the value of one variable can be used to predict the value of an outcome variable. The formula for a straight line is the basis for this model:
Yi = (b0+b1Xi) + εi
- Y = outcome variable, X = explanatory variable, b0 = value of outcome when explanatory variable has a value of zero (intercept), b1 = regression coefficient for the explanatory variable, εi = error.
Simple linear regression models can be represented as 'lines of best fit' or regression lines on scatterplots (shown below). Module 2 discusses simple
linear regression in more detail.
discusses simple
linear regression in more detail.
-
Skew
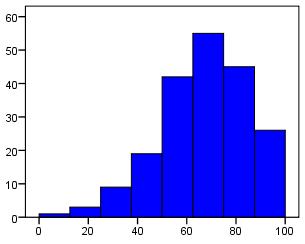
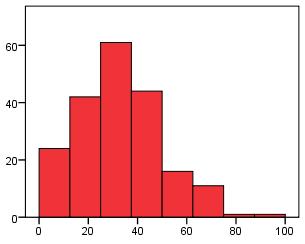
Skew is used to refer to the symmetry of a normal distribution. A distribution is positively skewed when the more frequent values are clustered at the lower end of the scale and the 'tail' of the distribution points towards the upper end. Negative skew is when the more frequent values are at the upper end of the scale with
the
tail pointing towards the lower end. See the histograms below for examples! Skewed distributions can sometimes indicate floor/ceiling effects.
Negative Skew
Positive Skew
-
Spearmans rho
Spearman's rho, or Spearman's correlation coefficient, is similar to pearson's r. It measures the strength and direction of a relationship between two variables and ranges from -1 to 1. It departs from Pearson's r in that it does not rely on the assumptions of a parametric test to be met - that is the data does
not
need to follow a particular distribution (such as the normal distribution). This means that it is best used with ordinal or ranked data.
-
Standard deviation
The standard deviation is the square root of the variance. As with variance it represents the average spread (variability) of the data but it is adjusted so that it maintains the same units of measurement as the original data. For this reason standard deviation is more commonly used than variance as a measure of variability.
-
Standard error
The standard error is the standard deviation of the sampling distribution of the statistic. That may sound confusing to the uninitiated so let's put it another way. Imagine you wanted to know the mean value of a variable in a given population. If you sampled that population multiple times you would get a different mean each time and
from
those means you could derive a new mean and standard deviation. This standard deviation is called the standard error and represents how accurate your estimate for the population mean is likely to be based on your sample. Low values mean you can be fairly confident that the value gained from your sample is close to the true value of
the
population. Standard errors can be calculated for lots of statistics, not just means.
-
Statistical Control
In the context of regression we often talk about 'controlling for' an explanatory variable. This broadly means that we are accounting for or removing this variable's effect on the outcome variable (specifically removing the variance in the outcome variable that is explained by our explanatory variable). This allows
us to
filter out the effects of confounding variables to look at the effect of the explanatory variables we are interested in more precisely.
-
Statistical significance
If a relationship between variables is found to exist in our sample we want to know how confident we can be that it reflects a 'real' relationship in the population as a whole, and is not just a characteristic of our sample. We adopt a null hypothesis that the relationship between variables does not exist
in the population, and we then test to see if there are sufficent grounds to reject this null hypothesis.
It is conventional for a relationship to be considered statistically significant if there is a less than 5% (or sometimes 1%) probability that it could have occurred in the sample by chance when in fact it does not occur in the population as a whole. Put in more common terms that is if p<.05 (or p<.01).
-
Stratified sample
When sampling it may be important that certain groups within the population (subpopulations) are well represented. To ensure that a reasonable number of participants from each group is selected stratified sampling can be used.
For example, you may want to explore whether ethnicity influences which courses students select to study at university. If you took a completely random sample you may get very small numbers of participants from those ethnic minorities which make up a small percentage of the overall population. In order to counteract this you use
stratified
sampling to randomly pick out a certain number of participants from each ethnic minority so each is well represented.
-
Sum of squares
In general terms the sum of squares estimates the variance of a set of data (how spread out it is). It is usually calculated by measuring how much each case deviates from the mean (or the regression line), squaring these deviances (to eliminate the negative signs) and adding them all together.
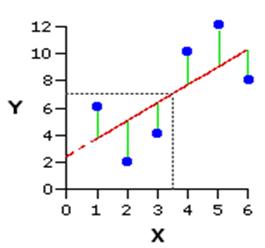
It is particularly useful when dealing with multiple regression as it provides an indication of error in the model (or more accuarately variance which the model cannot explain). The deviances between the regression line and the data points are called residuals and by squaring them and summing them together we have a
residual sum of squares. In the graph below the green lines illustrate residuals - these differences are summed and squared as an indicator of the total error in the model.
-
Syntax Editor
The SPSS Syntax Editor is an extra program window in which you can enter, edit and run 'syntax'. Broadly speaking, syntax is the programming language of SPSS. Though initially intimidating it can provide a very useful and efficient way of using SPSS and is therefore worth persevering with!

