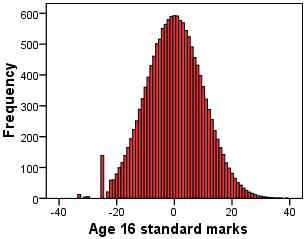
A histogram is simply a graph that plots a frequency distribution of data for a variable. The values of the variable go along the X-axis while the number of data points with that value (the frequency) are plotted on the Y-axis. Histograms are a great way to check whether or not your data is normally distributed. Here is an example:
Homoscedasticity
Homoscedasticity is an assumption in regression analysis. For the assumption to be met residuals at each level of the explanatory variable(s) must have similar variances. That is error variance should be fairly constant across all the levels of an explanatory variable.
Hosmer and Lemeshow Test
The Hosmer and Lemeshow test is basically a way of ascertaining how well the data fits the model. It is calculated using the deviance (-2LL) and produces a p-value based on a chi-square distribution.
It tests the null hypothesis that the model is a good enough fit for the data. As usual, we only reject the null hypothesis if p<.05, so in this case the model is a good fit if the p value is greater than .05 (p>.05).