-
R Squared
r2 is also known as the coefficient of determination and is literally the correlation coefficient squared. It represents how much of the variance in the outcome can be explained by the explanatory variable/s. It is represented as a proportion between 0 and 1, with 0 indicating that the model does
not
explain any of the variation in the outcome and 1 indicating that it predicts the outcome perfectly. An r2 of 0.5 suggests that the model can explain 50% of the variability in the outcome.
-
Ratio Variable
A Ratio Variable is similar to an interval variable but with the added distinction that there is a fixed zero point. For interval variables the difference between any two consecutive values is the same across the scale but they might not relate to any fixed score of '0'. Ratio Variables have a value of '0' and so you can say
that
a value of four is precisely twice a value of two and half a value of 8. Common measurements such as height, weight and temperature have this property.
-
Regression coefficient
The regression coefficient is depicted by B in SPSS and represents the relationship between a given explanatory variable and the outcome variable. It is precisely how much the outcome variable changes after a change of one unit in the explanatory variable. It is essentially the gradient of the linear
relationship.
There is also a standardized regression coefficient (usually depicted by β) which allows you to more accurately compare the relative strengths of the relationship between different explanatory variable and the outcome. This is the change in the outcome variable associated with a change of one standard deviation
in
the explanatory variable.
-
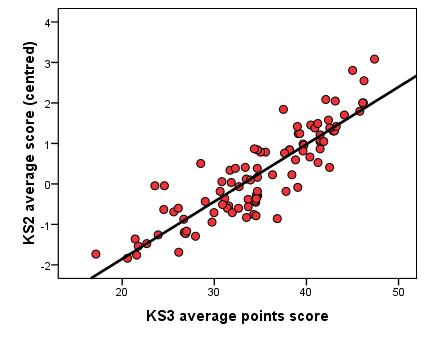
Regression line
The regression line, also known as the line of best fit, is the basis of linear models of regression when visualizing a relationship using a scatterplot. If data about the explanatory variables are known for a particular case than the outcome variable for that case can be estimated using the regression line. Regression lines
are
only really practical when using one and (at a push!) two explanatory variables. The example below shows a regression line for a simple linear regression.
-
Reliability
In quantitative research reliability refers specifically to a property of our measures. It is whether the measure produces consistent results, whether they are stable, consistent and replicable. For example imagine I administer a reading test to my class today and repeat the test a week later. If this is a reliable test I would expect there to
be
a strong correlation between individual's scores on the two ocassions. There are different ways of assessing reliability for different kinds of measures - test-retest, split-half, Cronbach's alpha or inter-rater reliability - but all are looking for the feature of consistency in measurement in circumstance where we would expect it.
-
Residuals
Regression analysis is designed to allow the researcher to predict an outcome based on data from one or more explanatory variables. However the model is never perfectly accurate and each actual data point is likely to differ slightly from the value predicted by the model. The residual is the difference foreach case between the actual outcome
and
the outcome predicted by the model. Often these are termed 'errors' in prediction but perhaps more accurately they represent variance that cannot be accounted for by the model.
-
Restriction in range
Restriction in range is a term used to refer to data that has does not have the full range of possible values. For example, if you were exploring the test scores of a gifted and talented population your sample would most likely produce data with 'ceiling effects' and would cluster near the top of the scale, therefore not using the full range
of
possible scores. When performing correlation analyses, data with restricted range may produce misleadingly low correlation coefficients and therefore result in inaccurate modelling of the outcome.

