

1.3.1 Survey and aggregate data
Micro or survey data are data on individual population units. This may be an individual person, household or company. For example, in a census every household fills in a form with the name and age of everyone in the house. These individual responses are collected together into one giant survey dataset. For example, when we look at the 1901 census, we can see the names of individual people, where they lived, what they did and how old they were when the census was taken (after 100 years, the data in the census is made publicly available).
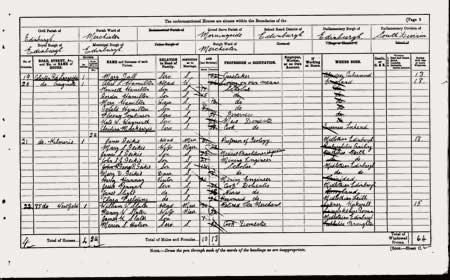
You can also see how a survey datasets allows you to analyse the relationships between individuals. The 1901 census tells you who lives in the same house, their family relationships and even who their neighbours were.
Often survey data is anonymised before release. This means that some details are removed to protect the identity of the respondent.
This example using the statistical software package SPSS shows how data can be viewed in its raw state or with additional variable information.
A key property of a survey dataset is that it allows you to understand the relationships between different characteristics at the level of the individual such as whether the level of a person's education affects the number of children they have. This makes survey data a very powerful resource for policy makers. The UK Data Service provides access and support for the UK large scale government surveys such as the Labour Force Survey.
Macro or aggregated data are data about populations, groups, regions or countries. Examples of aggregate indicators are life expectancy or employment rates. These are data that have been averaged, totalled or otherwise derived from the individual level data found in the survey datasets. Most of the aggregate data we are going to talk about in this section is data about countries.
UKDS.Stat showing some typical aggregate data.
Aggregate country data is usually in the form of time series data, with repeated observations of the same indicator for the same country at regular intervals.
Global emissions of carbon dioxide rose by 88% between 1971 and 2004 and are projected to rise by another 52% by 2030. In 1971, the current OECD countries were responsible for 66% of the total. As a consequence of rapidly increasing emissions in the developing world, the OECD contributed 49% to the total in 2004, but this is expected to fall to 38% by 2030. By far, the largest increases in non-OECD countries occurred in Asia, where emissions in China have risen by 5.5% per annum between 1971 and 2004. The use of coal in China increased levels of CO2 by 3.2 billion tonnes over the 33-year period.
Two significant downturns can be seen in OECD CO2 emissions, following the oil shocks of the mid-1970s and early 1980s. Emissions from the economies in transition declined over the last decade, helping to offset the OECD increases between 1990 and the present. However, this decline did not stabilise global emissions as emissions in developing countries grew.
Disaggregating the emissions data shows substantial variations within individual sectors. Between 1971 and 2004, the combined share of electricity and heat generation and transport shifted from one half to two thirds of global emissions.
Fossil fuel shares in overall emissions changed slightly during the period. The relative weight of coal in global emissions has remained at approximately 40% since the early 1970s. The share of natural gas has increased from 15% in 1971 to 20% in 2004. Oil's share decreased from 49% to 40%. Fuel switching and the increasing use of non-fossil energy sources reduced the CO2/total primary energy supply (TPES) ratio by 7% over the past 33 years.
Source OECD Factbook, http://www.oecd-ilibrary.org/economics/oecd-factbook_18147364
