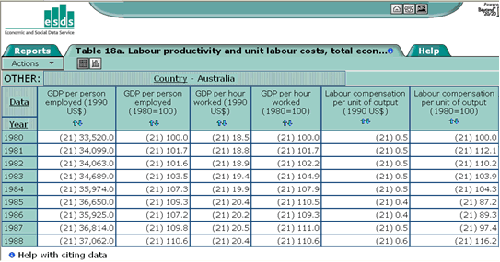
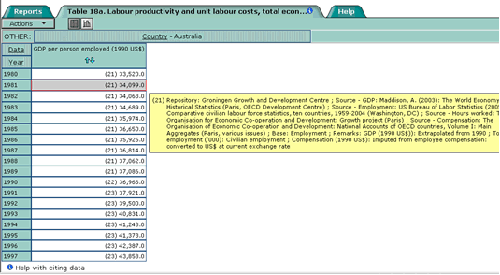
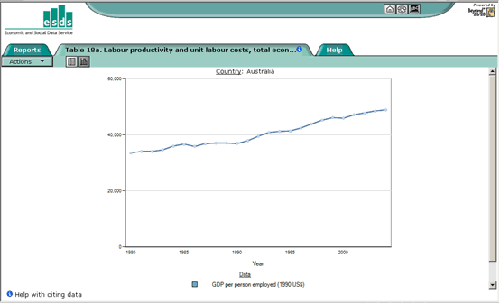
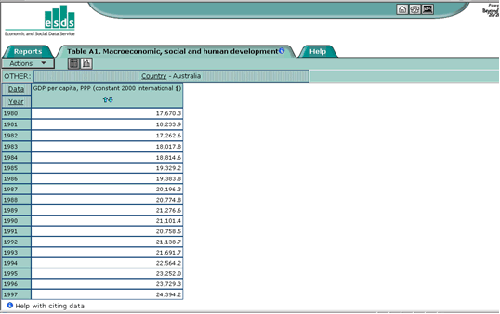
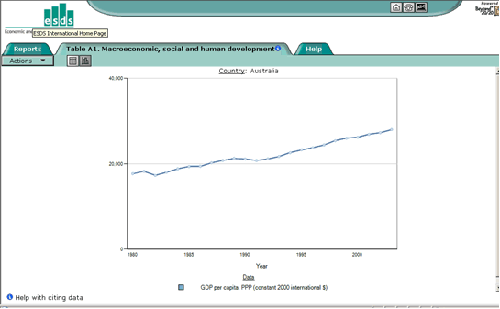
Follow steps 1-8 to produce 'GDP per capita' and 'GDP per employee' results for Australia.
If there are such examples they might occur because:
unemployment rate has changed;
demographic variables have changed;
participation rate (rate that people want to participate in the labour market) has changed.
Note that the two series have values that are very different. This is because they have different base year values: 1990, 2000.
You could produce, on a spreadsheet, indices of the two series based on a common value for a common initial year. You could then plot them on a chart. This would allow an easy visual comparison.
But you should be aware that the will be an element of incomparability as the PPP base years will be different.
(Note: GDP per employee is a PPP series although this is not stated in the series header)