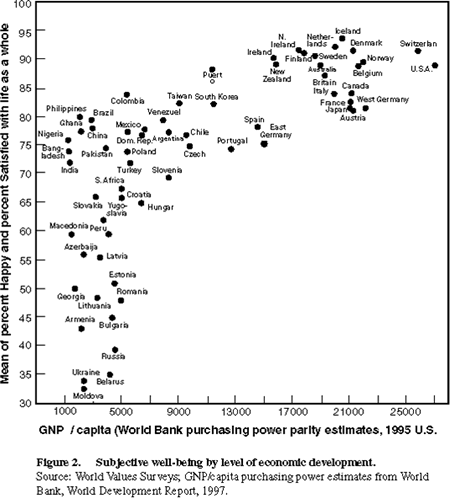
In this example from the World Values Survey we find a classic combining micro and macro data finding. The plot shows how level of happiness vary with a measure of a country's income per person. The way this graph is usually interpreted is that at low levels of income, a small increase in income results in a large increase in happiness. At higher levels of income, changes in average wealth have a smaller effect on how satisfied people feel about their lives.