Open your web browser and go to:
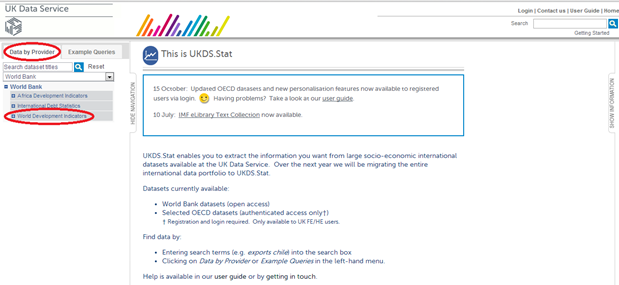
The World Bank data is open access. However, there are other datasets available on UKDS.Stat which require registration, and are only accessible to UK Further/Higher Education staff and students. To access or register to the UKDS click on ‘Login’ on the top right of the page.
To access World Bank Development Indicators dataset click ‘Data by Provider’. We host three of the World Bank databases; select ‘World Development Indicators’ and then ‘WDI – Latest Data’
In the World Bank World Development Indicators, the data is broken down by subject, time and location. These are called ‘dimensions’ in UKDS.Stat.
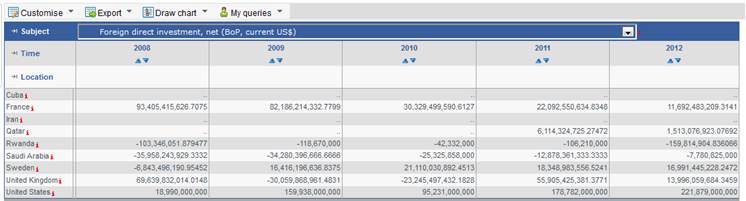
When you first open the database, you are presented with a selection of data,, which is shown in the screen shot below. You can change the countries, years and subjects displayed and even rearrange the dimensions to display the data to fit your needs.
We will now select the desired country dimension items by clicking on ‘Location’. All countries have been selected by default, you can select as many or as few countries as you wish. Click on ‘Unselect all’ and place a tick in the check box next to the country name. Scroll down and select the following:
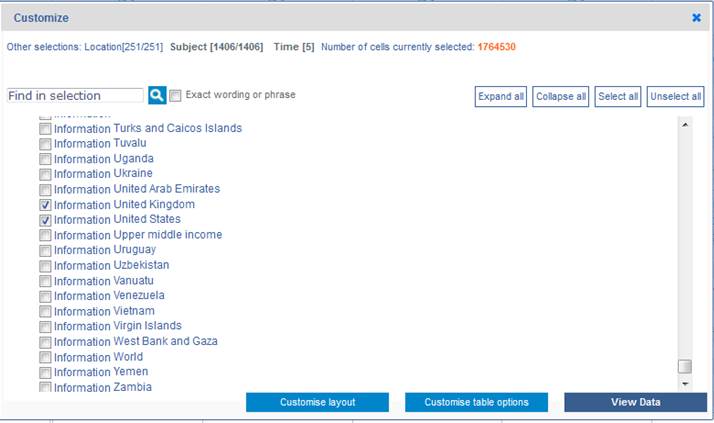
Click View data
Once all ten countries have been ticked, move onto next dimension, which is ‘Subject’.
Click on it to bring up the dimension menu.
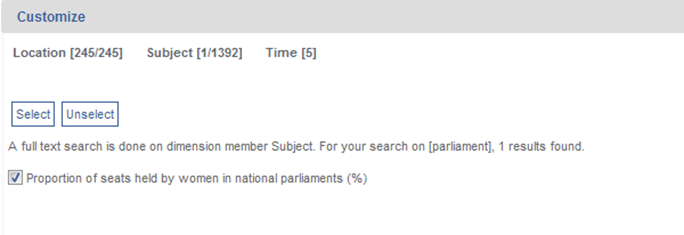
A list of all the series in the World Development Indicators appears. Type
parliament into the search input box and click on the ![]() icon. You will
now
find a single series named Proportion of seats held by women in national
parliaments.
icon. You will
now
find a single series named Proportion of seats held by women in national
parliaments.
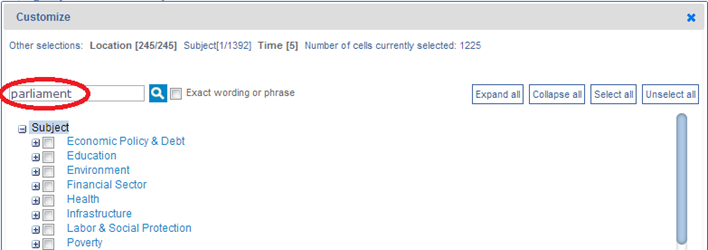
This will bring up a single result Proportion of seats held by women in national parliaments (%). Click on‘Select’.
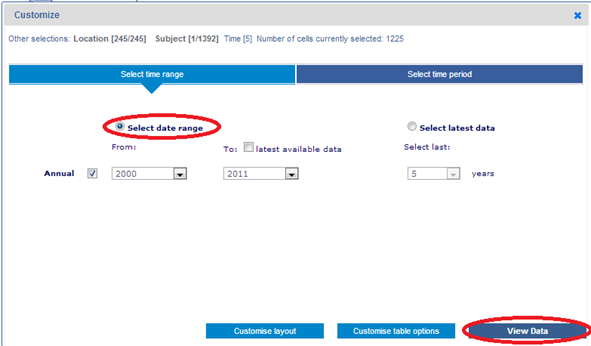
In order to move onto next dimension, click on ‘Time. We want to tick all
years
in between 2000 and 2011. Tick ‘Select date range’ and select under
‘From:’
the year 2000 and under ‘To:’ the year 2011 from the drop down menus.
You
have now completed the Finding and Selecting data stage and can move on to
visualising
your data by clicking on ‘View data’.
You have now completed the Finding and Selecting data stage and can move on to visualising your data.


