Aggregating School Data to LSOA Using Gazetteer Files in SASPAC
Researchers sometimes need to deal with datasets that are geo-referenced to different geographies. The
process normally involves grouping (e.g. aggregating) or dividing (e.g. allocating) data from one level
to another. The Office for National Statistics (ONS) maintains a webpage for users to download look-up
tables that provide information on Super Output Area (SOA) constitution and the associated conversions
among contemporary administrative and census geographies covering England and Wales. Equivalent tables
are also available for Scotland from the General Register Office Scotland and for Northern Ireland from
the Northern Ireland Statistics and Research Agency. Academic users can also perform this task using the
GeoConvert tool, which is ideal for small to medium sized datasets post-2006.
Example: Download SOA Look-ups from the Neighbourhood Statistics (NeSS) Site
The SOA constitution and look-up tables for England and Wales are available for download from the NeSS
site (http://www.neighbourhood.statistics.gov.uk/dissemination/).
At the time of writing, this SOA resources page can be found by clicking the "About Neighbourhood
Statistics" section link at the lower left corner on the NeSS homepage. The look-ups are located
under Geography > Super Output Areas > SOA Lookup Files.
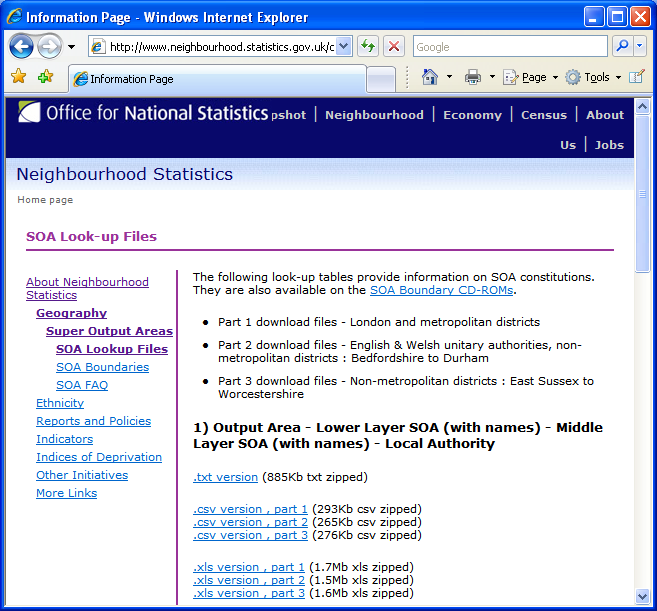
A range of area coding look-ups are provided. To demonstrate how data can be rezoned using gazetteer
files, we rezone census data from output area to lower layer super output area (LSOA). Note that there
is another layer of SOAs known as middle layer super output area (MSOA). We shall therefore need to
download either Table 1) or 2) that contains the Output Area - LSOA look-up. Choose the ".txt"
version, save the zip archive to a local folder and then unzip its content. There should now be a single
comma-delimited text file containing the look-up data.
Creating a Gazetteer File for SASPAC using Microsoft Access
Two columns of area code are required in a valid SASPAC gazetteer file. The first column should contain
codes which match the zoneids in an existing SASPAC system file (containing the data to be aggregated)
while the second one is for the new zone to which data are to be aggregated. The file must not have
field labels and should be saved in a "fixed-width" format. In order to make the downloaded
TXT table to be ready for SASPAC, we can use Microsoft Access to reformat the data. At the same time, we
can also reduce the number of records to only the areas that are required.
Start Microsoft Access. Select File > New and click the "Blank database..." icon on the New
File pane. Name the blank database as "oa_lsoa_lookup.mdb" and save the file to a local
folder.
Select File > Get External Data > Import... and change the "Files of type:" option to
"Text Files (*.txt; *.csv; *.tab; *.asc)" to import the look-up file previously downloaded
from NeSS. Ensure that comma is chosen as the field delimiter type and the first row contains field
names before creating the table in Microsoft Access. Repeat the same steps to import the CSV file of the
OA-coded school performance data ("schools_byoa.csv" )that you should have previously
created.
Select Insert > Query and use the "Design View " option to rearrange the data. Add both
tables to the query. Delete the linking between the ID fields. Instead, link the two tables via the
"OA_code" and "Output Area" fields. Drag and drop "OA_code"and "LSOA_code"
from the table to the output grid.
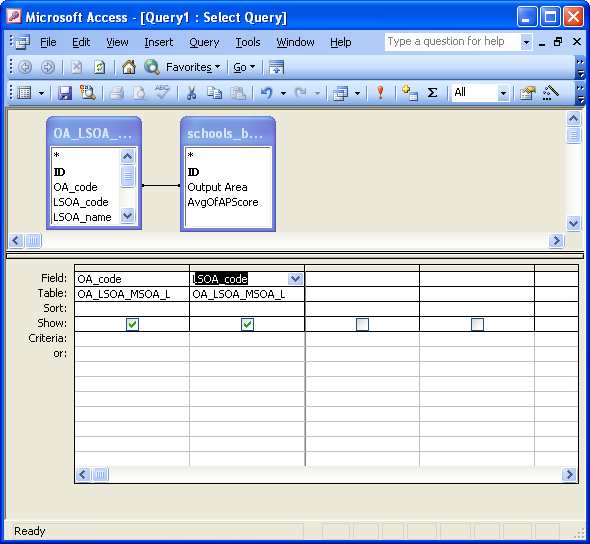
Exit and save the query as "newham_schools_lookup". Double-clicking on the query title in the
Queries list should display a two-column table containing the OA and associated LSOA codes for the areas
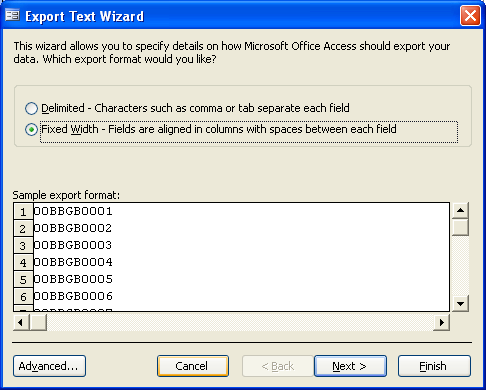
where there is a primary school. The table can now be exported as a text file, select File >
Export... and change the Save as type: to "Text files (*.txt; *.csv; *tab; *asc)". If
required, change the saving location to be the same folder as the original TXT file. Accept the default
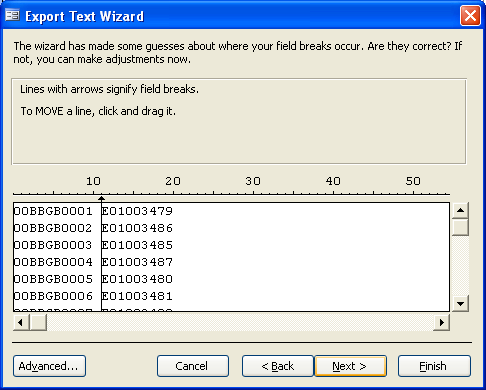
filename ("newham_schools_lookup") and export the data. In the Export Text Wizard dialog box,
change the export format to be "Fixed Width". Don't worry if the second column of data is not
visible at this stage which is due to the default use of very wide fields.
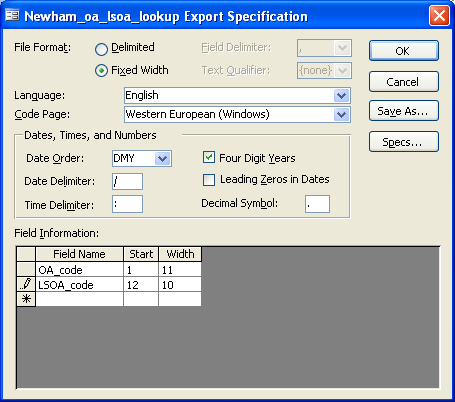
Click the "Advanced..." button to correct the field width. A new dialog box will appear to
allow users to specify the start position and width of each data item. The width of the "OA_code"
should be 10 but to give a white space between the data, set it to be "11". Also change the
start position and width of LSOA_code to be "12" and "10" respectively. Again, the
width of LSOA_code should be "9" but the extra space is added to separate this column from the
optional scale factor values that can be added should users wish. Please refer to the SASPAC help for
further details on the use of scale factors.
Click OK to save the changes and then Next> in the Export Text Wizard dialog box to check that the
data items are correctly separated.
Click Finish to export the data. The gazetteer named as "newham_oa_lsoa_lookup.txt" should now
be created in the local folder.
Rezoning Census Data Using SASPAC
The text file exported can now be used by SASPAC to rezone data from OAs to LSOAs. Using the school
performance SYS file ("SCHOOLS_BYOA.SYS") created in the previous step of this example, you
can determine the average Key Stage 2 performance results of the primary schools in each LSOA zone.
Please note if you did not attend the workshop or complete the prerequisite steps before reaching this
part of the exercise, you can click [here]
to download the working data.
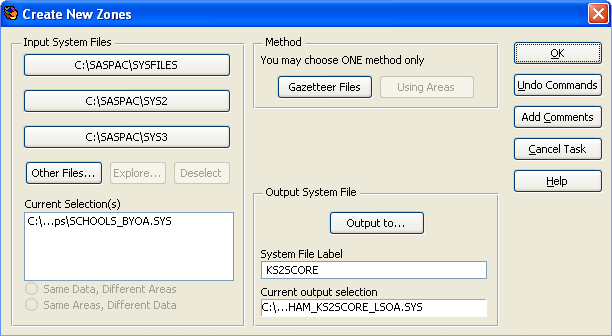
Start SASPAC. Close the "Quickstart" task menu if it is launched. Select File > New Task
> Create New Zone to aggregate the variables in the KS table from OA to LSOA. The Create New Zone
dialog box will appear. First Click the "Other Files..." button to open the newly-created SYS
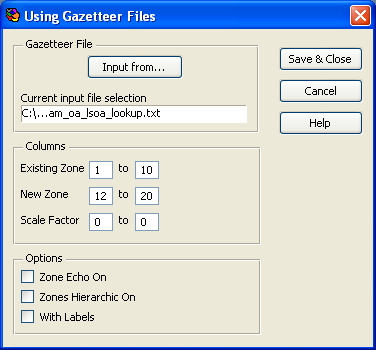
file. After loading the system file, click the "Gazetteer Files" button in the Method section
to specify the input text file. Use the "Input from..." button to locate and open the
gazetteer file. Remember to change the Files of type: to "All Files (*.*)". Specify the start
and finish position of the existing and new zone. For the existing zone, the start and finish columns
should be "1" and "10" whereas those for the new zone are "12" and "20".
Each OA zone in this example is nested wholly within one LSOA zone so there is no need to use the scale
factor column specifications. Leave all the other options unchecked and click Close to complete the
input gazetteer's process. Again, please refer to SASPAC Help if you would like to explore the other
available options for this command.
Click the "Output to..." button and name the output file "NEWHAM_KS2SCORE_LSOA.SYS".
Accept the default folder location (that is likely to be "C:\SASPAC\SYSFILES\"). Choose a
simple textual label (no space or special characters) for the System File Label field.
Click OK and the Task dialog box will appear. Accept the default settings and click OK again to execute
the task. A new system file listing the "KS2SCORE" data against the LSOA code in Newham should
now be created and can be used directly in SASPAC.
Analysing Rezoned Data
In this example, we are going to determine the average KS2 point score of the primary schools in each of
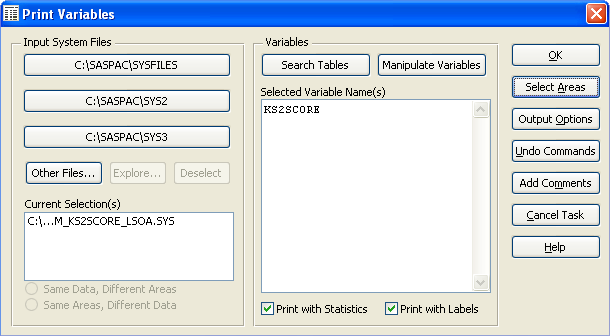
LSOA. To do that, close the current log file window and select File > New Task > Output Report
> Print Variables... Click the "Other Files..." button and select the newly created "NEWHAM_KS2SCORE_LSOA.SYS"
system file and input "KS2SCORE" into the "Select Variable Name(s)" box within the
Variables section. KS2SCORE is the variable containing total KS2 point score of the primary schools in
Newham. Check the boxes for both "Print with Statistics" and "Print with Labels"
options.
Click OK. Accept all the default settings shown in the Task dialog box and click OK to continue. After
the commands have been run successfully, a report PRN file should be created. To examine the results,
close the current log file window and select File > Open > Open Print File... and open the output
PRN file (most likely to be called "SASPAC.PRN" located in "C:\SASPAC\REPORT\"
unless you have changed the default settings in the Task dialog box). The counts of pre-school children
are now aggregated to the LSOA level as shown below.
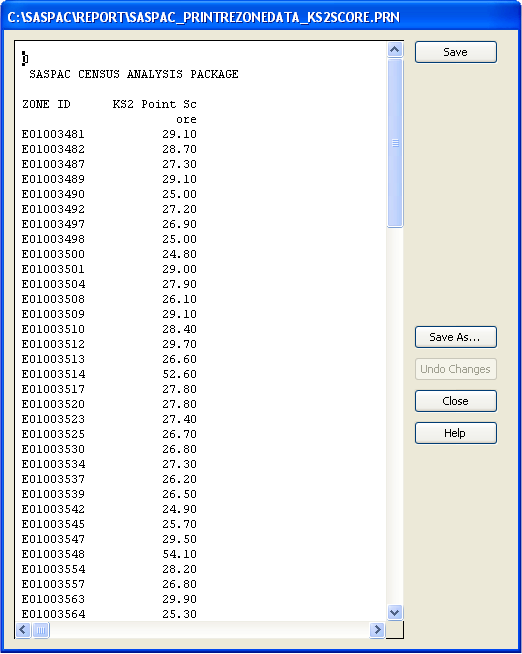
At the bottom of the file you should also find the summary statistics showing the standard deviation,
maximum and minimum counts, plus the counts of missing values if there are any mismatches between the
original and aggregated zones. This a plain text file so it can edited by a text editor, e.g. Microsoft
Wordpad, for further use.
Exporting Rezoned Data in CSV for Mapping in MapShore
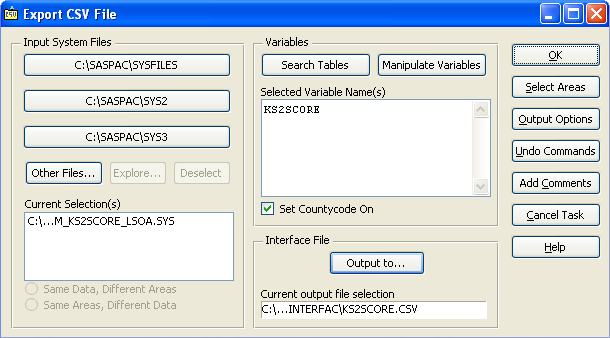
To map the results using MapShore, close all the existing SASPAC windows. Select File > New Task >
Export data > CSV File... and click the "Other Files..." button. Select the newly created
"NEWHAM_KS2SCORE_LSOA.SYS" system file and input "KS2SCORE" into the "Select
Variable Name(s)" box within the Variables section. Click the "Output to..." button.
Accept the default location (which is likely to be "C:\SASPAC\INTERFAC\") and name the file as
"ks2score.csv". Please note that SASPAC is not case sensitive and tends to change all filename to
uppercase regardless of the user inputs.
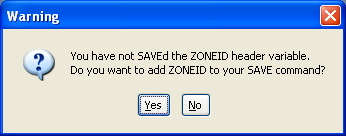
Click OK and then Yes when prompted to add the ZONEID header variable to the output file.
In the Task dialog box, accept all the default settings and click OK to execute the SASPAC commands. If
any of the system or output file already exist, the file replacement warning will appear. Discard the
warning and click Continue or Yes to proceed. The commands should then be completed with the following
message appearing in the log file window:
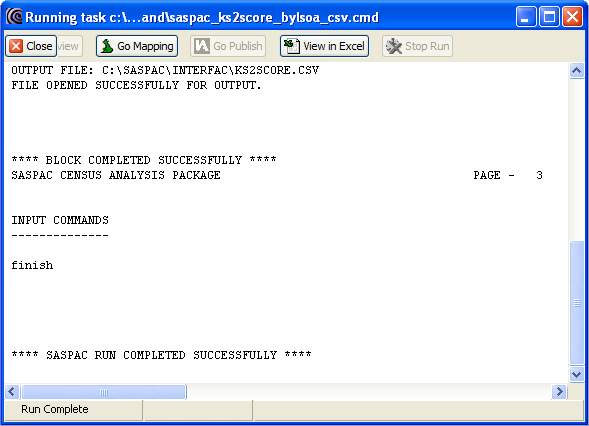
The process will create the "ks2score.csv" file in the default output file folder of SASPAC
(normally in "C\SASPAC\INTERFAC\"). The aggregated data is the total of KS2SCORE of all
primary schools in one LSOA. To determine the average score across each LSOA zone, the total score can
be divided by the number of schools. As the range of score should be between 20 and 30, the easiest way
to find out the zone average will be dividing any score greater than 30 by 2, greater than 60 by 3 and
so on. To do that, open "ks2score.csv" using a text editor (but not Microsoft Excel as it will
remove the quotes surrounding the ZONEID text strings). There are 4 entries where the value of KS2SCORE
should be halved:
"E01003514",52.60
"E01003548",54.10
"E01003581",52.50
"E01003591",50.40
The average score should become 26.30, 27.05, 26.25 and 25.20. After making the changes, save the file as
"ks2score_avg.csv". This modified file in conjunction with the boundary data ("00BBA_Newham_CAs.bdy")
can then be imported to MapShore for further mapping.
Copyright Attribution
The Small Area Statistics Package (SASPAC) software is owned by the Improvement and Development Agency
for Local Government (IDeA). MapShore is a registered trademark of Pebbleshore Ltd. Access™, Excel®
and WordPad are registered trademarks of Microsoft Corporation. The software screen shots shown in this
page are reprinted with permission from IDeA, Pebbleshore Ltd. and Microsoft Corporation.
 Homepage