Linking and Mapping School Performance and Deprivation Data
In this example we will create a thematic map showing school performance and deprivation data using
MapShore in association with Microsoft Access.
Two CSV files "IDRANK_NEWHAM.CSV" and "KS2SCORE_AVG.CSV" are required. The files
should have been created earlier and are most likely located at "C:\SASPAC\INTERFACE\" unless
you have chosen to save the files to a different folder. If you did not attend the workshop or complete
the prerequisite steps before reaching this part of the exercise, you can click [here] to download
"IDRANK_NEWHAM.CSV" and then [here]
for "KS2SCORE_AVG.CSV".
Another file that is required to complete this exercise is "newham_low_soa_2001.shp" which
contains the boundary data of the area. If you did not have a copy of the data yet, click [here] to download the zip archive. The shapefile and
its associated files can be found after unzipping the archive.
Using Microsoft Access to Prepare MapShore-compatible Data File
The first task is merge the school performance and deprivation data into one single file. If both data
have identical zone identifiers and contain the same number of records, it will be best to combine their
respective SYS files in SASPAC and output the merged data as a CSV file to MapShore for mapping.
Unfortunately, in this example not all the LSOA zones will have a primary school so the linkage has to
be carried out in Microsoft Access.
Start Microsoft Access. Select File > New > and click the "Blank database..." icon on the
New File pane. Name the blank database as "idrank_ks2score_newham.mdb". Import the two CSV
files ("IDRANK_NEWHAM.CSV" and "KS2SCORE_AVG.CSV") using the comma-delimited format.
The first line of both files contains the field labels for the data. After the CSV files have been
imported, create a new query using the Design View. Add both tables to the query. Delete the link
between the ID fields of the two tables. The tables should be linked by the "ZONEID" column
which is the actual common field. To ensure all LSOAs are included, right-click on the link between the
"ZONEID" fields and select "Join Properties". Choose the option that include all
records from "IDRANK_NEWHAM".
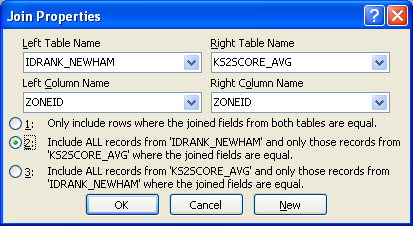
Click OK and then drag and drop "ZONEID" and "ID20070002" from the "IDRANK_NEWHAM"
table and "KS2SCORE" from "KS2SCORE_AVG" to the output grid . Save the query as
"idrank_ks2score_newham" and export the results using the same name in the CSV format to the
local folder. The merged data can now be mapped using MapShore.
Mapping School Performance and Deprivation Data in MapShore
Start MapShore (if it is not already running). Select Boundary > Retrieve... and navigate to the
location where the LSOA boundary file ("newham_low_soa_2001.shp") is saved earlier. Open the
file which will display the area ID and name assignment dialog box.
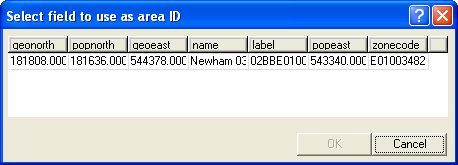
Select "zonecode" (the last column) as the area ID and "name" as the area name.
After the boundary data have appeared, select Data > Retrieve Area Data... to import the ID2007
ranking to the current map. Navigate to the local folder where "idrank_ks2score_newham.csv"
has been saved. Open the area data file (SASPAC is not case sensitive when handling filenames). You will
then be prompted to pick one of the two attributes to be displayed on the map. Select "ID20070002"
this time and each LSOA zone will be shaded according to its IMD ranking. A zonal key should also be
shown. In case the zonal key is not visible, you will need to select Display > Zonal Key to turn on
the key. It is unlikely that the data type and range will be appropriate in the first instance. Click
the Interval button on the zonal key and alter the values as follows:
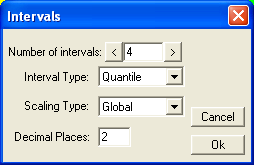
Click Ok to apply the changes. Click the "Ramp" and then the "Redisp." buttons on the
key to change the multi-coloured scheme to a graduated shading pattern which is better for mapping
continuous data.
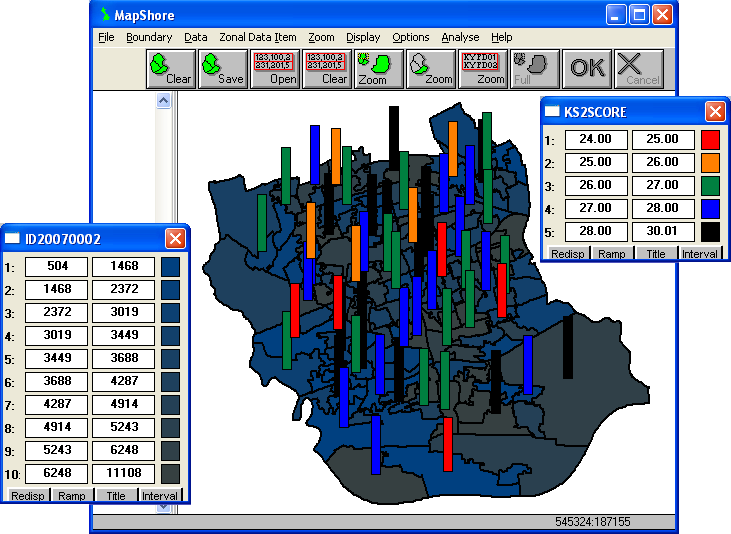
The school performance data can now be added to the map display using proportional symbols. Select
Options > Map Type, tick the "Graduated Rectangles" and choose "KS2SCORE" as the
data item. Turn on the Graduated Key to alter the data interval and colour, your final map may look like
this:
Use the Export or Print commands to generate an output file. If you intend to use the results in future,
save the work to a MapShore Library (.LIB) file.
Copyright Attribution
The Small Area Statistics Package (SASPAC) software is owned by the Improvement and Development Agency
for Local Government (IDeA). MapShore is a registered trademark of Pebbleshore Ltd and AccessT is a
registered trademark of Microsoft Corporation. The software screen shots shown in this page are
reprinted with permission from Pebbleshore Ltd and Microsoft Corporation. The maps shown above are based
on data provided through EDINA UKBORDERS with the support of the ESRC and JISC and uses boundary
material which is copyright of the Crown
 Homepage