Joining and Mapping Census and Boundary Data in ArcGIS
In this example you will download census data from Casweb and map it within ArcGIS. You can try
downloading any data for any geographical units in any area, however for the purposes of this exercise
it is probably worth keeping the variables simple and the number of areas relatively small. For example,
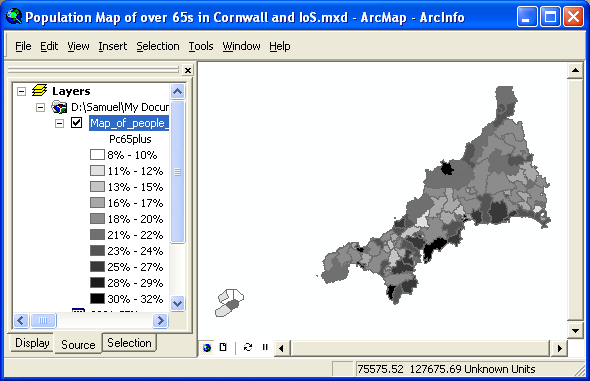
you could try mapping the percentage of people over 65 years old in wards in Cornwall - as demonstrated
here. This will require you to download the total number of people and the number of people persons aged
65 and over, and then to calculate the percentage. Note that you can either calculate the percentage
within Casweb and download it as one of the output variables or you can calculate the percentage in
ArcGIS.
1. Download census data from Casweb
Use an Internet browser to navigate to the Casweb website at http://census.ac.uk/casweb/.
To use Casweb you must already be registered through the Census Registration Service at http://census.ac.uk/Register_start.aspx.
Logging on to Casweb you will be prompted either for an Athens ID or institutional login ID, depending
on your institution, before gaining access to the datasets.
First, select the dataset to be used (for this example, select 2001 Aggregate Statistics Datasets).
Select the geographical area for which data are required (e.g. Country: England > Lower level
geographies: South West > Counties: Cornwall and Isles of Scilly). Casweb will guide you
diagrammatically through the structure of local government areas. Then select the output level at which
data are required (e.g. CAS wards) from the list displayed at the bottom of the screen.
There are multiple census datasets available for any particular geographical units. Casweb presents a
rather complex screen with several areas. The top left panel lists the available datasets, the bottom
left panel displays the census tables and the right hand panel shows the currently selected data (rather
like the "shopping basket" in a site such as Amazon). For our example, select the Key Statistics and the
lower left panel shows the available tables of data for the currently selected geography level (wards).
Table KS002 contains the age structure. Highlighting this table and selecting Display Table Layout will
reveal the cells of information available. In this case there is one cell relating to 'All people' but
in order to obtain the population aged 65 and over it will also be necessary to retrieve the last four
cells. When the boxes next to each of the desired cells have been checked, click on Add Variables to
Data Selection, which will add them to the list on the right. At this stage it is possible to return to
the list of tables and add additional variables if required. It is advisable to highlight each variable
in turn in the list of selected data and rename it at this stage to something more memorable, such as
"totpop", "age6574", etc. It is generally safest to begin the variable name with a letter and stick to a
limit of eight alphanumeric characters.
When data selection is complete, click on the Get Data button. Casweb will prompt for a name for the
download and offer some options regarding the format of the output file. Leave these set as comma
separated and " as the text delimiter, which can be easily read by Microsoft Office applications such as
Excel and Access.
2. Check, clean and edit the data
The census data which you have just downloaded are termed attribute data. It is good practice to check,
clean and edit any downloaded attribute data before attempting to link or map it. We advise that you
import these attribute data into Microsoft Access. Check that the fields all look sensible and have the
correct data types, rename any fields where relevant and delete any unnecessary fields or rows. The key
fields which you will need are: the ward code (zone code), ward name (zone name) and the census
variables, including the total population denominator. You will need to remove the title/header
information and probably shorten the fieldnames (a maximum length of 8 characters is usually recommended
to ensure successful transfer between different software packages). When you have finished, save the
file and export the data in dBASE IV format (.dbf).
3. Download digital boundary data from UKBORDERS
Navigate to the UKBORDERS website at http://edina.ac.uk/ukborders/.
Login and select Boundary Data Selector. Then select the relevant Country (England), Geography (census
boundaries) and Dates (post 1999). Click Find and then select the relevant areas from the resultant list
(in this case, as Cornwall is a County, you will need to select English Census Area Statistic Wards
2001) and click on List Areas. Select Cornwall and Isles of Scilly from the list and then click Extract
Boundary Data. When the extraction has completed, save the downloaded file to an appropriate location.
You will probably need to unzip the file before using it.
4. Joining attribute data to boundary data in ArcGIS and calculating a new variable
You can now import the attribute and boundary data into ArcGIS and then join the attributes to the
boundaries. Add the shapefile containing the Cornwall wards as a layer to the map. Then add the table
containing the census data to the map as well. Join the attribute data to the shapefile layer (by
right-clicking on the shapefile layer's name in the Table of Contents and selecting Joins & Relates >
Join). Indicate that you wish to join attribute data from a table and select the relevant field from the
layer on which the join should be based (i.e. ons_label). Then select the relevant table which you wish
to join to the layer (i.e. your census data) and the field on which to base the join (in this case,
ZONE_CODE). Click OK and your data will be joined to the layer. You can make the join permanent by
exporting the shapefile layer to another shapefile layer: right-click on the layer's name, select Data >
Export Data, provide a location and name for the new shapefile and then click OK. Add the new shapefile
to the map when prompted.
To create a new variable such as percentage aged over 65, open the attribute table to which you want to
add the new variable and use the Options button > Add Field. Once your new field has been added to the
table, right-click on the field header and use the Field Calculator option to enter the calculator
environment. In the case of the example used here, percentage aged over 65 will be obtained by the
formula ([age6574]+[age7584]+[age8590]+[age90ov])/[totpop]. The newly calculated variable can then be
mapped.
5. Creating a choropleth map
You can now go ahead and explore the census data. Try creating various choropleth maps of the variables
like the one shown below. Right-click on the layer's name in the Table of Contents and then select
Properties. In the dialog box, select Symbology. You will most likely wish to create either a map for
continuous data (select Quantities) or categorical data (select Categories). You can then experiment
with different colour schemes, classification schemes, etc. Finally, you may wish to create a Map
Document which you could then either print or export in digital format for use in another software
package such as Microsoft Word or Powerpoint.
Copyright Attribution
ArcGIS® and ArcMap® are registered trademarks of Environmental Systems Research Institute, Inc.
(ESRI). dBASE is a registered trademark of dBASE Inc. Access™ and, Excel® are part of the
Microsoft® Office product which is a registered trademark of Microsoft Corporation. The software
screen shots shown in this page are reprinted with permission from ESRI. The maps shown above are based
on data provided through EDINA UKBORDERS with the support of the ESRC and JISC and uses boundary
material which is copyright of the Crown.
 Homepage