Black output is produced by SPSS. Other colours are comments.
For comments on how to run code see the html version of SPSS source code
Links in this page
Summary % missing
Patterns of missing data
Means and variance covariance estimates after missing data replaced with estimate from EM algorithm
Graph of imputed data
Exploratory analysis of imputed data
Logistic regression for imputed data
Same thing excluding missing data
MVA
Summary of proportions missing for each variable.
|
N |
Mean |
Std. Deviation |
Missing |
No. of Extremes(a) |
|||
|
Count |
Percent |
Low |
High |
||||
|
SASMKY80 |
4031 |
.26 |
.680 |
297 |
6.9 |
0 |
183 |
|
SBSMKY80 |
4125 |
.47 |
1.046 |
203 |
4.7 |
0 |
346 |
|
SCSMKY80 |
4206 |
.93 |
1.413 |
122 |
2.8 |
0 |
551 |
|
SDSMKY80 |
4114 |
1.10 |
1.525 |
214 |
4.9 |
0 |
0 |
|
SESMKY80 |
3845 |
1.20 |
1.596 |
483 |
11.2 |
0 |
0 |
|
SFSMKY80 |
3487 |
1.31 |
1.632 |
841 |
19.4 |
0 |
0 |
|
RAALCY80 |
4010 |
.65 |
.869 |
318 |
7.3 |
0 |
161 |
|
RBALCY80 |
4130 |
1.13 |
1.296 |
198 |
4.6 |
0 |
274 |
|
RCALCY80 |
4230 |
2.00 |
1.368 |
98 |
2.3 |
0 |
0 |
|
RDALCY80 |
4061 |
2.32 |
1.369 |
267 |
6.2 |
0 |
0 |
|
REALCY80 |
3814 |
2.91 |
1.519 |
514 |
11.9 |
0 |
0 |
|
RFALCY80 |
3502 |
2.37 |
1.298 |
826 |
19.1 |
0 |
39 |
|
GENDER |
4328 |
1.49 |
.500 |
0 |
.0 |
0 |
0 |
|
ETHGP |
4328 |
1.95 |
.228 |
0 |
.0 |
237 |
0 |
|
SAAGEGP |
4328 |
2.46 |
.794 |
0 |
.0 |
0 |
0 |
|
HZRESPRE |
4328 |
1.81 |
.391 |
0 |
.0 |
815 |
0 |
|
SZINDEP |
4328 |
.56 |
.496 |
0 |
.0 |
0 |
0 |
|
SZABS04 |
4328 |
1.46 |
.499 |
0 |
.0 |
0 |
0 |
|
HZEVREFI |
4328 |
1.89 |
.311 |
0 |
.0 |
468 |
0 |
|
YZLEAVE |
4328 |
1.71 |
.456 |
0 |
.0 |
0 |
0 |
|
sector |
4328 |
1.17 |
.480 |
0 |
.0 |
0 |
89 |
|
dprev1 |
3899 |
.73 |
.444 |
429 |
9.9 |
0 |
0 |
|
dvar1 |
3899 |
2.47 |
2.577 |
429 |
9.9 |
0 |
217 |
|
dprev2 |
3992 |
.73 |
.446 |
336 |
7.8 |
0 |
0 |
|
dvar2 |
3992 |
2.84 |
2.982 |
336 |
7.8 |
0 |
226 |
|
dprev3 |
4077 |
.78 |
.414 |
251 |
5.8 |
0 |
0 |
|
dvar3 |
4077 |
3.43 |
3.343 |
251 |
5.8 |
0 |
168 |
|
dprev4 |
3997 |
.74 |
.437 |
331 |
7.6 |
0 |
0 |
|
dvar4 |
3997 |
3.08 |
3.253 |
331 |
7.6 |
0 |
227 |
|
dprev5 |
3752 |
.71 |
.454 |
576 |
13.3 |
0 |
0 |
|
dvar5 |
3752 |
2.21 |
2.545 |
576 |
13.3 |
0 |
189 |
|
dprev6 |
3394 |
.59 |
.492 |
934 |
21.6 |
0 |
0 |
|
dvar6 |
3394 |
1.36 |
1.901 |
934 |
21.6 |
0 |
141 |
|
drgcode1 |
4056 |
.12 |
.509 |
272 |
6.3 |
0 |
175 |
|
drgcode2 |
4152 |
.14 |
.554 |
176 |
4.1 |
0 |
160 |
|
drgcode3 |
4218 |
.39 |
.878 |
110 |
2.5 |
0 |
348 |
|
drgcode4 |
4121 |
.54 |
.972 |
207 |
4.8 |
0 |
470 |
|
drgcode5 |
3847 |
.39 |
.658 |
481 |
11.1 |
0 |
129 |
|
drgcode6 |
3510 |
.64 |
.985 |
818 |
18.9 |
0 |
430 |
a Number of cases outside the range (Mean - 2*SD, Mean + 2*SD).
Now patterns of missing data for variables in combination.
back to top Tabulated Patterns ![]()
Number of Cases |
Missing Patterns(a) |
Complete if ...(b) |
||||||||||||||
dprev3 |
dvar3 |
columns omitted here to make table fit |
dvar2 |
drgcode1 |
dprev6 |
dvar6 |
||||||||||
2242 |
2242 |
|||||||||||||||
95 |
X |
X |
2337 |
|||||||||||||
84 |
2413 |
|||||||||||||||
57 |
2299 |
|||||||||||||||
95 |
2337 |
|||||||||||||||
72 |
X |
2460 |
||||||||||||||
66 |
2308 |
|||||||||||||||
85 |
X |
X |
2327 |
|||||||||||||
282 |
X |
X |
2656 |
|||||||||||||
133 |
X |
X |
2997 |
|||||||||||||
86 |
X |
2328 |
||||||||||||||
57 |
X |
X |
2678 |
|||||||||||||
Patterns with less than 1% cases (43 or fewer) are not displayed.
a Variables are sorted on missing patterns.
b Number of complete cases if variables missing in that pattern (marked with X) are not used.
Now summary statistics once missing data imputed with the EM algorithm.
Summary of estimated means
|
SA-SMKY80 |
SB-SMKY80 |
SC-SMKY80 |
SD-SMKY80 |
SE-SMKY80 |
SF-SMKY80 |
those are the smoking variables further variables in more columns |
|
|
All Values |
.26 |
.47 |
.93 |
1.10 |
1.20 |
1.31 |
|
|
EM |
.27 |
.49 |
.95 |
1.16 |
1.31 |
1.45 |
And a small piece of the large correlation table
back to top|
SASMKY80 |
SBSMKY80 |
SCSMKY80 |
SDSMKY80 |
SESMKY80 |
SFSMKY80 |
|
|
SASMKY80 |
1 |
|||||
|
SCSMKY80 |
.435 |
.601 |
1 |
|||
|
SDSMKY80 |
.384 |
.530 |
.744 |
1 |
||
|
SFSMKY80 |
.327 |
.434 |
.588 |
.698 |
.811 |
1 |
The test above is very strong indication that the data are not missing at random, ie the missingness is related to one or more of the observed variables.
Next analyses are run on the output data set created by the EM option of the MVA procedure.
Graph shows imputed non-integer values
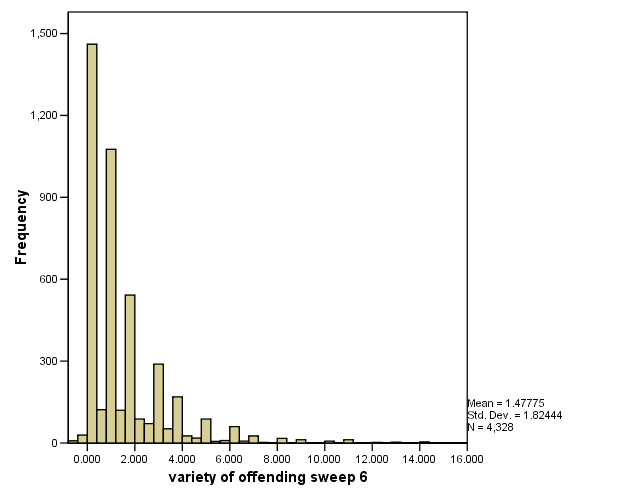
This overcome by rounding data to nearest integer
But we get nconsistent results after rounding seen for group where offending prevalence is zero
|
These should all be 0/0 is prevalence is zero |
variety of offending sweep 6 |
Total |
|||||||
|
0 |
1 |
2 |
|||||||
|
volume of offending sweep 6 |
0 |
1464 |
0 |
0 |
1464 |
||||
|
1 |
29 |
16 |
0 |
45 |
|||||
|
2 |
19 |
25 |
0 |
44 |
|||||
|
3 |
2 |
19 |
0 |
21 |
|||||
|
4 |
0 |
11 |
0 |
11 |
|||||
|
5 |
0 |
4 |
0 |
4 |
|||||
|
6 |
0 |
6 |
0 |
6 |
|||||
|
7 |
0 |
4 |
1 |
5 |
|||||
|
8 |
0 |
0 |
3 |
3 |
|||||
|
9 |
0 |
1 |
1 |
2 |
|||||
|
10 |
0 |
0 |
2 |
2 |
|||||
|
20 |
0 |
1 |
0 |
1 |
|||||
|
Total |
1514 |
87 |
7 |
1608 |
|||||
Now part of the logistic regression output complete imputed cases
Categorical Variables Codings
|
Frequency |
Parameter coding |
||||||||
|
(1) |
(2) |
(3) |
|||||||
|
Drug use summary code at sweep 6 |
none |
2366 |
.000 |
.000 |
.000 |
||||
|
only cannabis |
1363 |
1.000 |
.000 |
.000 |
|||||
|
only glue |
155 |
.000 |
1.000 |
.000 |
|||||
|
other drug or comb |
444 |
.000 |
.000 |
1.000 |
|||||
|
Drug use summary code at sweep 1 |
none |
4071 |
.000 |
.000 |
.000 |
||||
|
only cannabis |
82 |
1.000 |
.000 |
.000 |
|||||
|
only glue |
106 |
.000 |
1.000 |
.000 |
|||||
|
other drug or comb |
69 |
.000 |
.000 |
1.000 |
|||||
|
Individual deprivation socio-economi |
Manual/high deprivation |
1899 |
1.000 |
|
|||||
|
Non-manual/low deprivation |
2429 |
.000 |
|||||||
|
Wh non white |
non-white |
237 |
1.000 |
||||||
|
white |
4091 |
.000 |
|||||||
|
Gender |
Male |
2189 |
1.000 |
||||||
|
Female |
2139 |
.000 |
|||||||
Variables in the Equation
|
B |
S.E. |
Wald |
df |
Sig. |
Exp(B) |
||
|
Step 1(a) |
drgcode6 |
237.670 |
3 |
.000 |
|||
|
drgcode6(1) |
1.270 |
.131 |
94.659 |
1 |
.000 |
3.562 |
|
|
drgcode6(2) |
3.024 |
.207 |
212.726 |
1 |
.000 |
20.564 |
|
|
drgcode6(3) |
1.496 |
.173 |
75.127 |
1 |
.000 |
4.466 |
|
|
drgcode1 |
37.450 |
3 |
.000 |
||||
|
drgcode1(1) |
1.473 |
.258 |
32.710 |
1 |
.000 |
4.363 |
|
|
drgcode1(2) |
.055 |
.325 |
.029 |
1 |
.865 |
1.057 |
|
|
drgcode1(3) |
.754 |
.301 |
6.290 |
1 |
.012 |
2.125 |
|
|
GENDER(1) |
.983 |
.117 |
70.756 |
1 |
.000 |
2.671 |
|
|
ETHGP(1) |
-.792 |
.340 |
5.423 |
1 |
.020 |
.453 |
|
|
SZINDEP(1) |
1.486 |
.118 |
157.356 |
1 |
.000 |
4.419 |
|
|
Constant |
-4.523 |
.162 |
775.552 |
1 |
.000 |
.011 |
|
a Variable(s) entered on step 1: drgcode6, drgcode1, GENDER, ETHGP, SZINDEP.
Now some tables to check out model
Drug use summary code at sweep 6 * anyoff Crosstabulation
|
anyoff |
Total |
||||
|
.00 |
1.00 |
||||
|
Drug use summary code at sweep 6 |
none |
Count |
2262 |
104 |
2366 |
|
% within Drug use summary code at sweep 6 |
95.6% |
4.4% |
100.0% |
||
|
only cannabis |
Count |
1155 |
208 |
1363 |
|
|
% within Drug use summary code at sweep 6 |
84.7% |
15.3% |
100.0% |
||
|
only glue |
Count |
73 |
82 |
155 |
|
|
% within Drug use summary code at sweep 6 |
47.1% |
52.9% |
100.0% |
||
|
other drug or comb |
Count |
370 |
74 |
444 |
|
|
% within Drug use summary code at sweep 6 |
83.3% |
16.7% |
100.0% |
||
|
Total |
Count |
3860 |
468 |
4328 |
|
|
% within Drug use summary code at sweep 6 |
89.2% |
10.8% |
100.0% |
||
Drug use summary code at sweep 1 * anyoff Crosstabulation
|
anyoff |
Total |
||||
|
.000000 |
1.000 |
||||
|
Drug use summary code at sweep 1 |
none |
Count |
3679 |
392 |
4071 |
|
% within Drug use summary code at sweep 1 |
90.4% |
9.6% |
100.0% |
||
|
only cannabis |
Count |
43 |
39 |
82 |
|
|
% within Drug use summary code at sweep 1 |
52.4% |
47.6% |
100.0% |
||
|
only glue |
Count |
93 |
13 |
106 |
|
|
% within Drug use summary code at sweep 1 |
87.7% |
12.3% |
100.0% |
||
|
other drug or comb |
Count |
45 |
24 |
69 |
|
|
% within Drug use summary code at sweep 1 |
65.2% |
34.8% |
100.0% |
||
|
Total |
Count |
3860 |
468 |
4328 |
|
|
% within Drug use summary code at sweep 1 |
89.2% |
10.8% |
100.0% |
||