Html Version of SAS output from exemplar 5 weighting
.
To see programme that was used for it view the SAS program file.
Links in this page
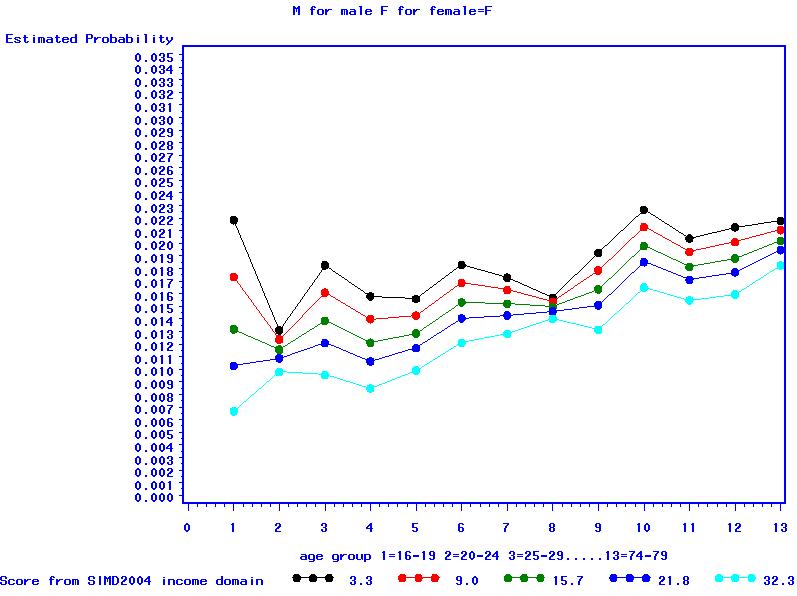
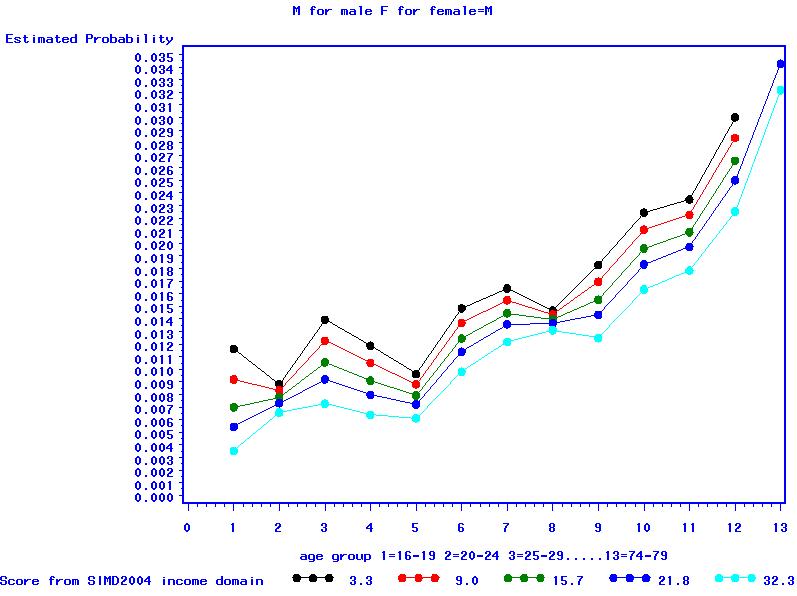
Modelling with categorical age groups
and plot categorical fit
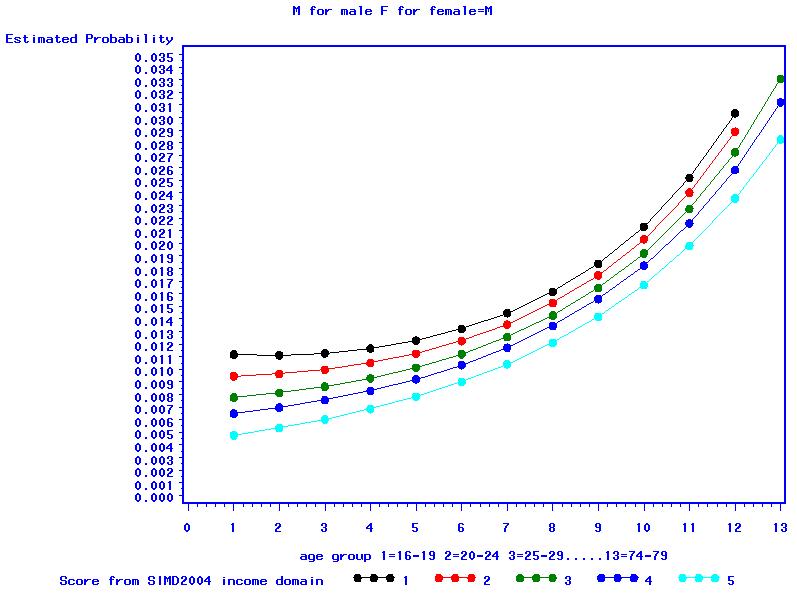
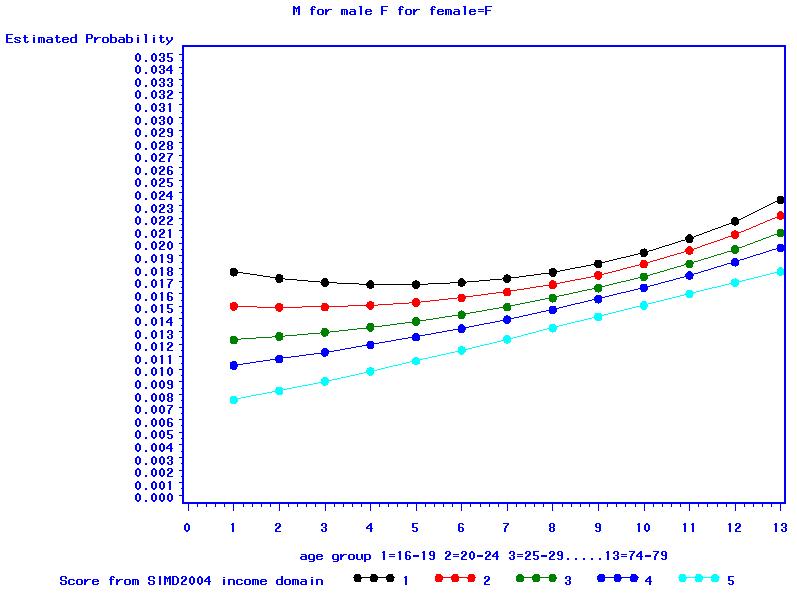
With continuous age groups
and plot continuous
Getting the predictor and the weights
| The MEANS Procedure |
| Variable | Label | Minimum | Maximum | Mean | Sum |
| npop AyrA_num |
2001 census population estimate number of respondents |
1.0000000 0 |
137.0000000 6.0000000 |
22.6077608 0.3339213 |
281986.60 4165.00 |
| The LOGISTIC Procedure |
| Model Information | ||
| Data Set | EXEMP5.EX5_WEIGHTING | |
| Response Variable (Events) | AyrA_num | number of respondents |
| Response Variable (Trials) | npop | 2001 census population estimate |
| Number of Observations | 12473 | |
| Model | binary logit | |
| Optimization Technique | Fisher's scoring | |
| Response Profile | ||
| Ordered Value |
Binary Outcome | Total Frequency |
| 1 | Event | 4165 |
| 2 | Nonevent | 277821.6 |
| Class Level Information | |||||||||||||
| Class | Value | Design Variables | |||||||||||
| 1 | 2 | 3 | 4 | 5 | 6 | 7 | 8 | 9 | 10 | 11 | 12 | ||
| agegrp | 1 | 1 | 0 | 0 | 0 | 0 | 0 | 0 | 0 | 0 | 0 | 0 | 0 |
| 2 | 0 | 1 | 0 | 0 | 0 | 0 | 0 | 0 | 0 | 0 | 0 | 0 | |
| 3 | 0 | 0 | 1 | 0 | 0 | 0 | 0 | 0 | 0 | 0 | 0 | 0 | |
| 4 | 0 | 0 | 0 | 1 | 0 | 0 | 0 | 0 | 0 | 0 | 0 | 0 | |
| 5 | 0 | 0 | 0 | 0 | 1 | 0 | 0 | 0 | 0 | 0 | 0 | 0 | |
| 6 | 0 | 0 | 0 | 0 | 0 | 1 | 0 | 0 | 0 | 0 | 0 | 0 | |
| 7 | 0 | 0 | 0 | 0 | 0 | 0 | 1 | 0 | 0 | 0 | 0 | 0 | |
| 8 | 0 | 0 | 0 | 0 | 0 | 0 | 0 | 1 | 0 | 0 | 0 | 0 | |
| 9 | 0 | 0 | 0 | 0 | 0 | 0 | 0 | 0 | 1 | 0 | 0 | 0 | |
| 10 | 0 | 0 | 0 | 0 | 0 | 0 | 0 | 0 | 0 | 1 | 0 | 0 | |
| 11 | 0 | 0 | 0 | 0 | 0 | 0 | 0 | 0 | 0 | 0 | 1 | 0 | |
| 12 | 0 | 0 | 0 | 0 | 0 | 0 | 0 | 0 | 0 | 0 | 0 | 1 | |
| 13 | -1 | -1 | -1 | -1 | -1 | -1 | -1 | -1 | -1 | -1 | -1 | -1 | |
| gender | F | 1 | |||||||||||
| M | -1 | ||||||||||||
| Model Convergence Status |
| Convergence criterion (GCONV=1E-8) satisfied. |
| Model Fit Statistics | ||
| Criterion | Intercept Only |
Intercept and Covariates |
| AIC | 43382.320 | 42880.063 |
| SC | 43392.870 | 43302.048 |
| -2 Log L | 43380.320 | 42800.063 |
| Testing Global Null Hypothesis: BETA=0 | |||
| Test | Chi-Square | DF | Pr > ChiSq |
| Likelihood Ratio | 580.2574 | 39 | <.0001 |
| Score | 593.1310 | 39 | <.0001 |
| Wald | 553.9269 | 39 | <.0001 |
| Type III Analysis of Effects | |||
| Effect | DF | Wald Chi-Square |
Pr > ChiSq |
| agegrp | 12 | 86.7719 | <.0001 |
| gender | 1 | 10.8543 | 0.0010 |
| agegrp*gender | 12 | 91.7986 | <.0001 |
| sinc*agegrp | 12 | 25.8603 | 0.0112 |
| sacc | 1 | 3.9165 | 0.0478 |
| sinc | 1 | 82.8782 | <.0001 |
| Analysis of Maximum Likelihood Estimates | |||||||
| Parameter | DF | Estimate | Standard Error |
Wald Chi-Square |
Pr > ChiSq | ||
| Intercept | 1 | -3.9857 | 0.0296 | 18112.8045 | <.0001 | ||
| agegrp | 1 | 1 | 0.000578 | 0.1170 | 0.0000 | 0.9961 | |
| agegrp | 2 | 1 | -0.5018 | 0.1275 | 15.4931 | <.0001 | |
| agegrp | 3 | 1 | -0.0605 | 0.1092 | 0.3067 | 0.5797 | |
| agegrp | 4 | 1 | -0.2187 | 0.1016 | 4.6296 | 0.0314 | |
| agegrp | 5 | 1 | -0.3505 | 0.0974 | 12.9403 | 0.0003 | |
| agegrp | 6 | 1 | -0.0553 | 0.0850 | 0.4231 | 0.5154 | |
| agegrp | 7 | 1 | -0.0456 | 0.0857 | 0.2832 | 0.5946 | |
| agegrp | 8 | 1 | -0.1742 | 0.0841 | 4.2946 | 0.0382 | |
| agegrp | 9 | 1 | 0.0731 | 0.0874 | 0.6986 | 0.4033 | |
| agegrp | 10 | 1 | 0.2539 | 0.0857 | 8.7880 | 0.0030 | |
| agegrp | 11 | 1 | 0.2181 | 0.0919 | 5.6336 | 0.0176 | |
| agegrp | 12 | 1 | 0.3675 | 0.0939 | 15.3084 | <.0001 | |
| gender | F | 1 | 0.0541 | 0.0164 | 10.8543 | 0.0010 | |
| agegrp*gender | 1 | F | 1 | 0.2666 | 0.0727 | 13.4552 | 0.0002 |
| agegrp*gender | 2 | F | 1 | 0.1459 | 0.0722 | 4.0839 | 0.0433 |
| agegrp*gender | 3 | F | 1 | 0.0832 | 0.0619 | 1.8075 | 0.1788 |
| agegrp*gender | 4 | F | 1 | 0.0902 | 0.0589 | 2.3470 | 0.1255 |
| agegrp*gender | 5 | F | 1 | 0.1895 | 0.0580 | 10.6821 | 0.0011 |
| agegrp*gender | 6 | F | 1 | 0.0516 | 0.0508 | 1.0328 | 0.3095 |
| agegrp*gender | 7 | F | 1 | -0.0284 | 0.0508 | 0.3114 | 0.5768 |
| agegrp*gender | 8 | F | 1 | -0.0201 | 0.0494 | 0.1660 | 0.6837 |
| agegrp*gender | 9 | F | 1 | -0.0278 | 0.0511 | 0.2971 | 0.5857 |
| agegrp*gender | 10 | F | 1 | -0.0492 | 0.0489 | 1.0109 | 0.3147 |
| agegrp*gender | 11 | F | 1 | -0.1265 | 0.0513 | 6.0936 | 0.0136 |
| agegrp*gender | 12 | F | 1 | -0.2304 | 0.0526 | 19.2240 | <.0001 |
| sinc*agegrp | 1 | 1 | -0.0267 | 0.00714 | 13.9919 | 0.0002 | |
| sinc*agegrp | 2 | 1 | 0.00452 | 0.00628 | 0.5178 | 0.4718 | |
| sinc*agegrp | 3 | 1 | -0.00795 | 0.00581 | 1.8729 | 0.1711 | |
| sinc*agegrp | 4 | 1 | -0.00697 | 0.00558 | 1.5623 | 0.2113 | |
| sinc*agegrp | 5 | 1 | -0.00108 | 0.00531 | 0.0417 | 0.8383 | |
| sinc*agegrp | 6 | 1 | 0.000259 | 0.00474 | 0.0030 | 0.9564 | |
| sinc*agegrp | 7 | 1 | 0.00423 | 0.00482 | 0.7716 | 0.3797 | |
| sinc*agegrp | 8 | 1 | 0.0108 | 0.00455 | 5.6145 | 0.0178 | |
| sinc*agegrp | 9 | 1 | 0.00133 | 0.00496 | 0.0720 | 0.7884 | |
| sinc*agegrp | 10 | 1 | 0.00354 | 0.00463 | 0.5864 | 0.4438 | |
| sinc*agegrp | 11 | 1 | 0.00503 | 0.00492 | 1.0470 | 0.3062 | |
| sinc*agegrp | 12 | 1 | 0.00457 | 0.00504 | 0.8204 | 0.3651 | |
| sacc | 1 | 0.0469 | 0.0237 | 3.9165 | 0.0478 | ||
| sinc | 1 | -0.0147 | 0.00161 | 82.8782 | <.0001 | ||
| Odds Ratio Estimates | |||
| Effect | Point Estimate | 95% Wald Confidence Limits |
|
| sacc | 1.048 | 1.000 | 1.098 |
| Association of Predicted Probabilities and Observed Responses |
|||
| Percent Concordant | 54.6 | Somers' D | 0.203 |
| Percent Discordant | 34.3 | Gamma | 0.228 |
| Percent Tied | 11.0 | Tau-a | 0.006 |
| Pairs | 1157126964 | c | 0.601 |
| The SAS System |
| The LOGISTIC Procedure |
| Model Information | ||
| Data Set | WORK.NEW | |
| Response Variable (Events) | AyrA_num | number of respondents |
| Response Variable (Trials) | npop | 2001 census population estimate |
| Number of Observations | 12473 | |
| Model | binary logit | |
| Optimization Technique | Fisher's scoring | |
| Response Profile | ||
| Ordered Value |
Binary Outcome | Total Frequency |
| 1 | Event | 4165 |
| 2 | Nonevent | 277821.6 |
| Class Level Information | |||||||||||||
| Class | Value | Design Variables | |||||||||||
| 1 | 2 | 3 | 4 | 5 | 6 | 7 | 8 | 9 | 10 | 11 | 12 | ||
| agegrp | 1 | 1 | 0 | 0 | 0 | 0 | 0 | 0 | 0 | 0 | 0 | 0 | 0 |
| 2 | 0 | 1 | 0 | 0 | 0 | 0 | 0 | 0 | 0 | 0 | 0 | 0 | |
| 3 | 0 | 0 | 1 | 0 | 0 | 0 | 0 | 0 | 0 | 0 | 0 | 0 | |
| 4 | 0 | 0 | 0 | 1 | 0 | 0 | 0 | 0 | 0 | 0 | 0 | 0 | |
| 5 | 0 | 0 | 0 | 0 | 1 | 0 | 0 | 0 | 0 | 0 | 0 | 0 | |
| 6 | 0 | 0 | 0 | 0 | 0 | 1 | 0 | 0 | 0 | 0 | 0 | 0 | |
| 7 | 0 | 0 | 0 | 0 | 0 | 0 | 1 | 0 | 0 | 0 | 0 | 0 | |
| 8 | 0 | 0 | 0 | 0 | 0 | 0 | 0 | 1 | 0 | 0 | 0 | 0 | |
| 9 | 0 | 0 | 0 | 0 | 0 | 0 | 0 | 0 | 1 | 0 | 0 | 0 | |
| 10 | 0 | 0 | 0 | 0 | 0 | 0 | 0 | 0 | 0 | 1 | 0 | 0 | |
| 11 | 0 | 0 | 0 | 0 | 0 | 0 | 0 | 0 | 0 | 0 | 1 | 0 | |
| 12 | 0 | 0 | 0 | 0 | 0 | 0 | 0 | 0 | 0 | 0 | 0 | 1 | |
| 13 | -1 | -1 | -1 | -1 | -1 | -1 | -1 | -1 | -1 | -1 | -1 | -1 | |
| gender | F | 1 | |||||||||||
| M | -1 | ||||||||||||
| sinc | 1 | 1 | 0 | 0 | 0 | ||||||||
| 2 | 0 | 1 | 0 | 0 | |||||||||
| 3 | 0 | 0 | 1 | 0 | |||||||||
| 4 | 0 | 0 | 0 | 1 | |||||||||
| 5 | -1 | -1 | -1 | -1 | |||||||||
| Model Convergence Status |
| Convergence criterion (GCONV=1E-8) satisfied. |
| Model Fit Statistics | ||
| Criterion | Intercept Only |
Intercept and Covariates |
| AIC | 43382.320 | 42881.843 |
| SC | 43392.870 | 43346.026 |
| -2 Log L | 43380.320 | 42793.843 |
| Testing Global Null Hypothesis: BETA=0 | |||
| Test | Chi-Square | DF | Pr > ChiSq |
| Likelihood Ratio | 586.4772 | 43 | <.0001 |
| Score | 599.1308 | 43 | <.0001 |
| Wald | 559.0707 | 43 | <.0001 |
| Type III Analysis of Effects | |||
| Effect | DF | Wald Chi-Square |
Pr > ChiSq |
| agegrp | 12 | 86.6923 | <.0001 |
| gender | 1 | 10.8204 | 0.0010 |
| agegrp*gender | 12 | 91.7326 | <.0001 |
| sincl*agegrp | 12 | 25.8254 | 0.0114 |
| sacc | 1 | 4.4277 | 0.0354 |
| sinc | 4 | 6.2273 | 0.1828 |
| sincl | 1 | 19.2762 | <.0001 |
| Analysis of Maximum Likelihood Estimates | |||||||
| Parameter | DF | Estimate | Standard Error |
Wald Chi-Square |
Pr > ChiSq | ||
| Intercept | 1 | -3.8611 | 0.0850 | 2065.7619 | <.0001 | ||
| agegrp | 1 | 1 | 0.000812 | 0.1172 | 0.0000 | 0.9945 | |
| agegrp | 2 | 1 | -0.5036 | 0.1280 | 15.4867 | <.0001 | |
| agegrp | 3 | 1 | -0.0610 | 0.1094 | 0.3105 | 0.5774 | |
| agegrp | 4 | 1 | -0.2188 | 0.1018 | 4.6226 | 0.0316 | |
| agegrp | 5 | 1 | -0.3503 | 0.0976 | 12.8870 | 0.0003 | |
| agegrp | 6 | 1 | -0.0559 | 0.0852 | 0.4305 | 0.5118 | |
| agegrp | 7 | 1 | -0.0460 | 0.0859 | 0.2867 | 0.5923 | |
| agegrp | 8 | 1 | -0.1751 | 0.0843 | 4.3172 | 0.0377 | |
| agegrp | 9 | 1 | 0.0735 | 0.0875 | 0.7058 | 0.4008 | |
| agegrp | 10 | 1 | 0.2552 | 0.0858 | 8.8415 | 0.0029 | |
| agegrp | 11 | 1 | 0.2186 | 0.0921 | 5.6335 | 0.0176 | |
| agegrp | 12 | 1 | 0.3678 | 0.0942 | 15.2565 | <.0001 | |
| gender | F | 1 | 0.0540 | 0.0164 | 10.8204 | 0.0010 | |
| agegrp*gender | 1 | F | 1 | 0.2665 | 0.0727 | 13.4453 | 0.0002 |
| agegrp*gender | 2 | F | 1 | 0.1458 | 0.0722 | 4.0757 | 0.0435 |
| agegrp*gender | 3 | F | 1 | 0.0829 | 0.0619 | 1.7969 | 0.1801 |
| agegrp*gender | 4 | F | 1 | 0.0904 | 0.0589 | 2.3562 | 0.1248 |
| agegrp*gender | 5 | F | 1 | 0.1894 | 0.0580 | 10.6649 | 0.0011 |
| agegrp*gender | 6 | F | 1 | 0.0516 | 0.0508 | 1.0344 | 0.3091 |
| agegrp*gender | 7 | F | 1 | -0.0283 | 0.0508 | 0.3088 | 0.5784 |
| agegrp*gender | 8 | F | 1 | -0.0200 | 0.0494 | 0.1633 | 0.6861 |
| agegrp*gender | 9 | F | 1 | -0.0278 | 0.0511 | 0.2965 | 0.5861 |
| agegrp*gender | 10 | F | 1 | -0.0491 | 0.0489 | 1.0051 | 0.3161 |
| agegrp*gender | 11 | F | 1 | -0.1267 | 0.0513 | 6.1071 | 0.0135 |
| agegrp*gender | 12 | F | 1 | -0.2306 | 0.0526 | 19.2544 | <.0001 |
| sincl*agegrp | 1 | 1 | -0.0268 | 0.00715 | 14.0226 | 0.0002 | |
| sincl*agegrp | 2 | 1 | 0.00459 | 0.00632 | 0.5279 | 0.4675 | |
| sincl*agegrp | 3 | 1 | -0.00794 | 0.00582 | 1.8582 | 0.1728 | |
| sincl*agegrp | 4 | 1 | -0.00698 | 0.00559 | 1.5609 | 0.2115 | |
| sincl*agegrp | 5 | 1 | -0.00111 | 0.00532 | 0.0435 | 0.8347 | |
| sincl*agegrp | 6 | 1 | 0.000302 | 0.00475 | 0.0040 | 0.9494 | |
| sincl*agegrp | 7 | 1 | 0.00421 | 0.00483 | 0.7578 | 0.3840 | |
| sincl*agegrp | 8 | 1 | 0.0108 | 0.00456 | 5.6280 | 0.0177 | |
| sincl*agegrp | 9 | 1 | 0.00133 | 0.00496 | 0.0722 | 0.7882 | |
| sincl*agegrp | 10 | 1 | 0.00347 | 0.00464 | 0.5596 | 0.4544 | |
| sincl*agegrp | 11 | 1 | 0.00504 | 0.00493 | 1.0457 | 0.3065 | |
| sincl*agegrp | 12 | 1 | 0.00459 | 0.00506 | 0.8246 | 0.3638 | |
| sacc | 1 | 0.0504 | 0.0240 | 4.4277 | 0.0354 | ||
| sinc | 1 | 1 | -0.0971 | 0.0725 | 1.7945 | 0.1804 | |
| sinc | 2 | 1 | -0.0779 | 0.0492 | 2.5034 | 0.1136 | |
| sinc | 3 | 1 | 0.0214 | 0.0317 | 0.4555 | 0.4997 | |
| sinc | 4 | 1 | -0.0124 | 0.0418 | 0.0876 | 0.7673 | |
| sincl | 1 | -0.0222 | 0.00505 | 19.2762 | <.0001 | ||
| Odds Ratio Estimates | |||
| Effect | Point Estimate | 95% Wald Confidence Limits |
|
| sacc | 1.052 | 1.003 | 1.102 |
| sinc 1 vs 5 | 0.769 | 0.564 | 1.049 |
| sinc 2 vs 5 | 0.784 | 0.604 | 1.017 |
| sinc 3 vs 5 | 0.865 | 0.707 | 1.059 |
| sinc 4 vs 5 | 0.837 | 0.716 | 0.977 |
| Association of Predicted Probabilities and Observed Responses |
|||
| Percent Concordant | 54.6 | Somers' D | 0.201 |
| Percent Discordant | 34.5 | Gamma | 0.226 |
| Percent Tied | 10.9 | Tau-a | 0.006 |
| Pairs | 1157126964 | c | 0.601 |
| The SAS System |
| The LOGISTIC Procedure |
| Model Information | ||
| Data Set | WORK.NEW | |
| Response Variable (Events) | AyrA_num | number of respondents |
| Response Variable (Trials) | npop | 2001 census population estimate |
| Number of Observations | 12473 | |
| Model | binary logit | |
| Optimization Technique | Fisher's scoring | |
| Response Profile | ||
| Ordered Value |
Binary Outcome | Total Frequency |
| 1 | Event | 4165 |
| 2 | Nonevent | 277821.6 |
| Class Level Information | |||||||||||||
| Class | Value | Design Variables | |||||||||||
| 1 | 2 | 3 | 4 | 5 | 6 | 7 | 8 | 9 | 10 | 11 | 12 | ||
| agegrp | 1 | 1 | 0 | 0 | 0 | 0 | 0 | 0 | 0 | 0 | 0 | 0 | 0 |
| 2 | 0 | 1 | 0 | 0 | 0 | 0 | 0 | 0 | 0 | 0 | 0 | 0 | |
| 3 | 0 | 0 | 1 | 0 | 0 | 0 | 0 | 0 | 0 | 0 | 0 | 0 | |
| 4 | 0 | 0 | 0 | 1 | 0 | 0 | 0 | 0 | 0 | 0 | 0 | 0 | |
| 5 | 0 | 0 | 0 | 0 | 1 | 0 | 0 | 0 | 0 | 0 | 0 | 0 | |
| 6 | 0 | 0 | 0 | 0 | 0 | 1 | 0 | 0 | 0 | 0 | 0 | 0 | |
| 7 | 0 | 0 | 0 | 0 | 0 | 0 | 1 | 0 | 0 | 0 | 0 | 0 | |
| 8 | 0 | 0 | 0 | 0 | 0 | 0 | 0 | 1 | 0 | 0 | 0 | 0 | |
| 9 | 0 | 0 | 0 | 0 | 0 | 0 | 0 | 0 | 1 | 0 | 0 | 0 | |
| 10 | 0 | 0 | 0 | 0 | 0 | 0 | 0 | 0 | 0 | 1 | 0 | 0 | |
| 11 | 0 | 0 | 0 | 0 | 0 | 0 | 0 | 0 | 0 | 0 | 1 | 0 | |
| 12 | 0 | 0 | 0 | 0 | 0 | 0 | 0 | 0 | 0 | 0 | 0 | 1 | |
| 13 | -1 | -1 | -1 | -1 | -1 | -1 | -1 | -1 | -1 | -1 | -1 | -1 | |
| gender | F | 1 | |||||||||||
| M | -1 | ||||||||||||
| Model Convergence Status |
| Convergence criterion (GCONV=1E-8) satisfied. |
| Model Fit Statistics | ||
| Criterion | Intercept Only |
Intercept and Covariates |
| AIC | 43382.320 | 42880.576 |
| SC | 43392.870 | 43313.111 |
| -2 Log L | 43380.320 | 42798.576 |
| Testing Global Null Hypothesis: BETA=0 | |||
| Test | Chi-Square | DF | Pr > ChiSq |
| Likelihood Ratio | 581.7441 | 40 | <.0001 |
| Score | 593.1368 | 40 | <.0001 |
| Wald | 552.4290 | 40 | <.0001 |
| Type III Analysis of Effects | |||
| Effect | DF | Wald Chi-Square |
Pr > ChiSq |
| agegrp | 12 | 84.9707 | <.0001 |
| gender | 1 | 10.8367 | 0.0010 |
| agegrp*gender | 12 | 91.8833 | <.0001 |
| sincl*agegrp | 12 | 25.8876 | 0.0111 |
| sacc | 1 | 4.3234 | 0.0376 |
| sinc | 1 | 4.6818 | 0.0305 |
| sinc2 | 1 | 1.4579 | 0.2273 |
| Analysis of Maximum Likelihood Estimates | |||||||
| Parameter | DF | Estimate | Standard Error |
Wald Chi-Square |
Pr > ChiSq | ||
| Intercept | 1 | -4.0192 | 0.0406 | 9804.4730 | <.0001 | ||
| agegrp | 1 | 1 | 0.00789 | 0.1180 | 0.0045 | 0.9467 | |
| agegrp | 2 | 1 | -0.5080 | 0.1288 | 15.5516 | <.0001 | |
| agegrp | 3 | 1 | -0.0617 | 0.1102 | 0.3137 | 0.5754 | |
| agegrp | 4 | 1 | -0.2175 | 0.1025 | 4.5010 | 0.0339 | |
| agegrp | 5 | 1 | -0.3495 | 0.0983 | 12.6564 | 0.0004 | |
| agegrp | 6 | 1 | -0.0534 | 0.0857 | 0.3875 | 0.5336 | |
| agegrp | 7 | 1 | -0.0433 | 0.0865 | 0.2511 | 0.6163 | |
| agegrp | 8 | 1 | -0.1751 | 0.0848 | 4.2634 | 0.0389 | |
| agegrp | 9 | 1 | 0.0752 | 0.0882 | 0.7275 | 0.3937 | |
| agegrp | 10 | 1 | 0.2531 | 0.0864 | 8.5810 | 0.0034 | |
| agegrp | 11 | 1 | 0.2160 | 0.0928 | 5.4227 | 0.0199 | |
| agegrp | 12 | 1 | 0.3649 | 0.0948 | 14.8182 | 0.0001 | |
| gender | F | 1 | 0.0540 | 0.0164 | 10.8367 | 0.0010 | |
| agegrp*gender | 1 | F | 1 | 0.2666 | 0.0727 | 13.4572 | 0.0002 |
| agegrp*gender | 2 | F | 1 | 0.1456 | 0.0722 | 4.0676 | 0.0437 |
| agegrp*gender | 3 | F | 1 | 0.0834 | 0.0619 | 1.8184 | 0.1775 |
| agegrp*gender | 4 | F | 1 | 0.0904 | 0.0589 | 2.3560 | 0.1248 |
| agegrp*gender | 5 | F | 1 | 0.1896 | 0.0580 | 10.6976 | 0.0011 |
| agegrp*gender | 6 | F | 1 | 0.0518 | 0.0508 | 1.0389 | 0.3081 |
| agegrp*gender | 7 | F | 1 | -0.0281 | 0.0508 | 0.3062 | 0.5800 |
| agegrp*gender | 8 | F | 1 | -0.0201 | 0.0494 | 0.1659 | 0.6837 |
| agegrp*gender | 9 | F | 1 | -0.0281 | 0.0511 | 0.3034 | 0.5818 |
| agegrp*gender | 10 | F | 1 | -0.0493 | 0.0489 | 1.0134 | 0.3141 |
| agegrp*gender | 11 | F | 1 | -0.1266 | 0.0513 | 6.0981 | 0.0135 |
| agegrp*gender | 12 | F | 1 | -0.2306 | 0.0526 | 19.2439 | <.0001 |
| sincl*agegrp | 1 | 1 | -0.0272 | 0.00723 | 14.1308 | 0.0002 | |
| sincl*agegrp | 2 | 1 | 0.00492 | 0.00638 | 0.5952 | 0.4404 | |
| sincl*agegrp | 3 | 1 | -0.00790 | 0.00589 | 1.8025 | 0.1794 | |
| sincl*agegrp | 4 | 1 | -0.00707 | 0.00565 | 1.5663 | 0.2107 | |
| sincl*agegrp | 5 | 1 | -0.00113 | 0.00537 | 0.0444 | 0.8331 | |
| sincl*agegrp | 6 | 1 | 0.000201 | 0.00480 | 0.0017 | 0.9667 | |
| sincl*agegrp | 7 | 1 | 0.00414 | 0.00488 | 0.7198 | 0.3962 | |
| sincl*agegrp | 8 | 1 | 0.0109 | 0.00461 | 5.5954 | 0.0180 | |
| sincl*agegrp | 9 | 1 | 0.00120 | 0.00502 | 0.0574 | 0.8107 | |
| sincl*agegrp | 10 | 1 | 0.00359 | 0.00469 | 0.5874 | 0.4434 | |
| sincl*agegrp | 11 | 1 | 0.00511 | 0.00498 | 1.0539 | 0.3046 | |
| sincl*agegrp | 12 | 1 | 0.00469 | 0.00511 | 0.8425 | 0.3587 | |
| sacc | 1 | 0.0494 | 0.0238 | 4.3234 | 0.0376 | ||
| sinc | 1 | -0.00965 | 0.00446 | 4.6818 | 0.0305 | ||
| sinc2 | 1 | -0.00013 | 0.000105 | 1.4579 | 0.2273 | ||
| Odds Ratio Estimates | |||
| Effect | Point Estimate | 95% Wald Confidence Limits |
|
| sacc | 1.051 | 1.003 | 1.101 |
| sinc | 0.990 | 0.982 | 0.999 |
| sinc2 | 1.000 | 1.000 | 1.000 |
| Association of Predicted Probabilities and Observed Responses |
|||
| Percent Concordant | 54.5 | Somers' D | 0.202 |
| Percent Discordant | 34.3 | Gamma | 0.228 |
| Percent Tied | 11.1 | Tau-a | 0.006 |
| Pairs | 1157126964 | c | 0.601 |
| The SAS System |
| The LOGISTIC Procedure |
| Model Information | ||
| Data Set | WORK.NEW | |
| Response Variable (Events) | AyrA_num | number of respondents |
| Response Variable (Trials) | npop | 2001 census population estimate |
| Number of Observations | 12473 | |
| Model | binary logit | |
| Optimization Technique | Fisher's scoring | |
| Response Profile | ||
| Ordered Value |
Binary Outcome | Total Frequency |
| 1 | Event | 4165 |
| 2 | Nonevent | 277821.6 |
|
| Class Level Information | |||||||||||||
| Class | Value | Design Variables | |||||||||||
| 1 | 2 | 3 | 4 | 5 | 6 | 7 | 8 | 9 | 10 | 11 | 12 | ||
| agegrp | 1 | 1 | 0 | 0 | 0 | 0 | 0 | 0 | 0 | 0 | 0 | 0 | 0 |
| 2 | 0 | 1 | 0 | 0 | 0 | 0 | 0 | 0 | 0 | 0 | 0 | 0 | |
| 3 | 0 | 0 | 1 | 0 | 0 | 0 | 0 | 0 | 0 | 0 | 0 | 0 | |
| 4 | 0 | 0 | 0 | 1 | 0 | 0 | 0 | 0 | 0 | 0 | 0 | 0 | |
| 5 | 0 | 0 | 0 | 0 | 1 | 0 | 0 | 0 | 0 | 0 | 0 | 0 | |
| 6 | 0 | 0 | 0 | 0 | 0 | 1 | 0 | 0 | 0 | 0 | 0 | 0 | |
| 7 | 0 | 0 | 0 | 0 | 0 | 0 | 1 | 0 | 0 | 0 | 0 | 0 | |
| 8 | 0 | 0 | 0 | 0 | 0 | 0 | 0 | 1 | 0 | 0 | 0 | 0 | |
| 9 | 0 | 0 | 0 | 0 | 0 | 0 | 0 | 0 | 1 | 0 | 0 | 0 | |
| 10 | 0 | 0 | 0 | 0 | 0 | 0 | 0 | 0 | 0 | 1 | 0 | 0 | |
| 11 | 0 | 0 | 0 | 0 | 0 | 0 | 0 | 0 | 0 | 0 | 1 | 0 | |
| 12 | 0 | 0 | 0 | 0 | 0 | 0 | 0 | 0 | 0 | 0 | 0 | 1 | |
| 13 | -1 | -1 | -1 | -1 | -1 | -1 | -1 | -1 | -1 | -1 | -1 | -1 | |
| gender | F | 1 | |||||||||||
| M | -1 | ||||||||||||
| Model Convergence Status |
| Convergence criterion (GCONV=1E-8) satisfied. |
| Model Fit Statistics | ||
| Criterion | Intercept Only |
Intercept and Covariates |
| AIC | 43382.320 | 42880.063 |
| SC | 43392.870 | 43302.048 |
| -2 Log L | 43380.320 | 42800.063 |
| Testing Global Null Hypothesis: BETA=0 | |||
| Test | Chi-Square | DF | Pr > ChiSq |
| Likelihood Ratio | 580.2574 | 39 | <.0001 |
| Score | 593.1310 | 39 | <.0001 |
| Wald | 553.9269 | 39 | <.0001 |
| Type III Analysis of Effects | |||
| Effect | DF | Wald Chi-Square |
Pr > ChiSq |
| agegrp | 12 | 86.7719 | <.0001 |
| gender | 1 | 10.8543 | 0.0010 |
| agegrp*gender | 12 | 91.7986 | <.0001 |
| sinc*agegrp | 12 | 25.8603 | 0.0112 |
| sacc | 1 | 3.9165 | 0.0478 |
| sinc | 1 | 82.8782 | <.0001 |
| Analysis of Maximum Likelihood Estimates | |||||||
| Parameter | DF | Estimate | Standard Error |
Wald Chi-Square |
Pr > ChiSq | ||
| Intercept | 1 | -3.9857 | 0.0296 | 18112.8045 | <.0001 | ||
| agegrp | 1 | 1 | 0.000578 | 0.1170 | 0.0000 | 0.9961 | |
| agegrp | 2 | 1 | -0.5018 | 0.1275 | 15.4931 | <.0001 | |
| agegrp | 3 | 1 | -0.0605 | 0.1092 | 0.3067 | 0.5797 | |
| agegrp | 4 | 1 | -0.2187 | 0.1016 | 4.6296 | 0.0314 | |
| agegrp | 5 | 1 | -0.3505 | 0.0974 | 12.9403 | 0.0003 | |
| agegrp | 6 | 1 | -0.0553 | 0.0850 | 0.4231 | 0.5154 | |
| agegrp | 7 | 1 | -0.0456 | 0.0857 | 0.2832 | 0.5946 | |
| agegrp | 8 | 1 | -0.1742 | 0.0841 | 4.2946 | 0.0382 | |
| agegrp | 9 | 1 | 0.0731 | 0.0874 | 0.6986 | 0.4033 | |
| agegrp | 10 | 1 | 0.2539 | 0.0857 | 8.7880 | 0.0030 | |
| agegrp | 11 | 1 | 0.2181 | 0.0919 | 5.6336 | 0.0176 | |
| agegrp | 12 | 1 | 0.3675 | 0.0939 | 15.3084 | <.0001 | |
| gender | F | 1 | 0.0541 | 0.0164 | 10.8543 | 0.0010 | |
| agegrp*gender | 1 | F | 1 | 0.2666 | 0.0727 | 13.4552 | 0.0002 |
| agegrp*gender | 2 | F | 1 | 0.1459 | 0.0722 | 4.0839 | 0.0433 |
| agegrp*gender | 3 | F | 1 | 0.0832 | 0.0619 | 1.8075 | 0.1788 |
| agegrp*gender | 4 | F | 1 | 0.0902 | 0.0589 | 2.3470 | 0.1255 |
| agegrp*gender | 5 | F | 1 | 0.1895 | 0.0580 | 10.6821 | 0.0011 |
| agegrp*gender | 6 | F | 1 | 0.0516 | 0.0508 | 1.0328 | 0.3095 |
| agegrp*gender | 7 | F | 1 | -0.0284 | 0.0508 | 0.3114 | 0.5768 |
| agegrp*gender | 8 | F | 1 | -0.0201 | 0.0494 | 0.1660 | 0.6837 |
| agegrp*gender | 9 | F | 1 | -0.0278 | 0.0511 | 0.2971 | 0.5857 |
| agegrp*gender | 10 | F | 1 | -0.0492 | 0.0489 | 1.0109 | 0.3147 |
| agegrp*gender | 11 | F | 1 | -0.1265 | 0.0513 | 6.0936 | 0.0136 |
| agegrp*gender | 12 | F | 1 | -0.2304 | 0.0526 | 19.2240 | <.0001 |
| sinc*agegrp | 1 | 1 | -0.0267 | 0.00714 | 13.9919 | 0.0002 | |
| sinc*agegrp | 2 | 1 | 0.00452 | 0.00628 | 0.5178 | 0.4718 | |
| sinc*agegrp | 3 | 1 | -0.00795 | 0.00581 | 1.8729 | 0.1711 | |
| sinc*agegrp | 4 | 1 | -0.00697 | 0.00558 | 1.5623 | 0.2113 | |
| sinc*agegrp | 5 | 1 | -0.00108 | 0.00531 | 0.0417 | 0.8383 | |
| sinc*agegrp | 6 | 1 | 0.000259 | 0.00474 | 0.0030 | 0.9564 | |
| sinc*agegrp | 7 | 1 | 0.00423 | 0.00482 | 0.7716 | 0.3797 | |
| sinc*agegrp | 8 | 1 | 0.0108 | 0.00455 | 5.6145 | 0.0178 | |
| sinc*agegrp | 9 | 1 | 0.00133 | 0.00496 | 0.0720 | 0.7884 | |
| sinc*agegrp | 10 | 1 | 0.00354 | 0.00463 | 0.5864 | 0.4438 | |
| sinc*agegrp | 11 | 1 | 0.00503 | 0.00492 | 1.0470 | 0.3062 | |
| sinc*agegrp | 12 | 1 | 0.00457 | 0.00504 | 0.8204 | 0.3651 | |
| sacc | 1 | 0.0469 | 0.0237 | 3.9165 | 0.0478 | ||
| sinc | 1 | -0.0147 | 0.00161 | 82.8782 | <.0001 | ||
| Odds Ratio Estimates | |||
| Effect | Point Estimate | 95% Wald Confidence Limits |
|
| sacc | 1.048 | 1.000 | 1.098 |
| Association of Predicted Probabilities and Observed Responses |
|||
| Percent Concordant | 54.6 | Somers' D | 0.203 |
| Percent Discordant | 34.3 | Gamma | 0.228 |
| Percent Tied | 11.0 | Tau-a | 0.006 |
| Pairs | 1157126964 | c | 0.601 |
| The LOGISTIC Procedure |
| Model Information | ||
| Data Set | WORK.NEW | |
| Response Variable (Events) | AyrA_num | number of respondents |
| Response Variable (Trials) | npop | 2001 census population estimate |
| Number of Observations | 12473 | |
| Model | binary logit | |
| Optimization Technique | Fisher's scoring | |
| Response Profile | ||
| Ordered Value |
Binary Outcome | Total Frequency |
| 1 | Event | 4165 |
| 2 | Nonevent | 277821.6 |
|
| Class Level Information | ||
| Class | Value | Design Variables |
| 1 | ||
| gender | F | 1 |
| M | -1 | |
| Model Convergence Status |
| Convergence criterion (GCONV=1E-8) satisfied. |
| Model Fit Statistics | ||
| Criterion | Intercept Only |
Intercept and Covariates |
| AIC | 43382.320 | 42861.844 |
| SC | 43392.870 | 42967.340 |
| -2 Log L | 43380.320 | 42841.844 |
| Testing Global Null Hypothesis: BETA=0 | |||
| Test | Chi-Square | DF | Pr > ChiSq |
| Likelihood Ratio | 538.4764 | 9 | <.0001 |
| Score | 548.2016 | 9 | <.0001 |
| Wald | 518.4962 | 9 | <.0001 |
| Type III Analysis of Effects | |||
| Effect | DF | Wald Chi-Square |
Pr > ChiSq |
| agegrp | 1 | 2.5496 | 0.1103 |
| gender | 1 | 12.3434 | 0.0004 |
| agegrp*gender | 1 | 0.0416 | 0.8383 |
| agegrp*sinc | 1 | 6.3632 | 0.0117 |
| agegrp*agegrp | 1 | 12.1040 | 0.0005 |
| agegrp*agegrp*gender | 1 | 3.4656 | 0.0627 |
| agegrp*agegrp*sinc | 1 | 3.1579 | 0.0756 |
| sacc | 1 | 3.8584 | 0.0495 |
| sinc | 1 | 28.3070 | <.0001 |
| Analysis of Maximum Likelihood Estimates | ||||||
| Parameter | DF | Estimate | Standard Error |
Wald Chi-Square |
Pr > ChiSq | |
| Intercept | 1 | -4.1032 | 0.1161 | 1248.0524 | <.0001 | |
| agegrp | 1 | -0.0552 | 0.0346 | 2.5496 | 0.1103 | |
| gender | F | 1 | 0.2400 | 0.0683 | 12.3434 | 0.0004 |
| agegrp*gender | F | 1 | -0.00413 | 0.0203 | 0.0416 | 0.8383 |
| agegrp*sinc | 1 | 0.00484 | 0.00192 | 6.3632 | 0.0117 | |
| agegrp*agegrp | 1 | 0.00806 | 0.00232 | 12.1040 | 0.0005 | |
| agegrp*agegrp*gender | F | 1 | -0.00251 | 0.00135 | 3.4656 | 0.0627 |
| agegrp*agegrp*sinc | 1 | -0.00023 | 0.000128 | 3.1579 | 0.0756 | |
| sacc | 1 | 0.0465 | 0.0237 | 3.8584 | 0.0495 | |
| sinc | 1 | -0.0343 | 0.00644 | 28.3070 | <.0001 | |
| Odds Ratio Estimates | |||
| Effect | Point Estimate | 95% Wald Confidence Limits |
|
| sacc | 1.048 | 1.000 | 1.097 |
| Association of Predicted Probabilities and Observed Responses |
|||
| Percent Concordant | 54.1 | Somers' D | 0.195 |
| Percent Discordant | 34.6 | Gamma | 0.220 |
| Percent Tied | 11.3 | Tau-a | 0.006 |
| Pairs | 1157126964 | c | 0.597 |
| the MEANS Procedure not much to show here |
| Variable | Mean | Maximum | Minimum | Sum |
| avweight gweight |
1.0033002 67.6898140 |
5.2458383 353.9218092 |
0.3725794 25.1368709 |
4178.75 281928.08 |