-
- Mod 3 - Multiple Reg
- 3.1 Overview
- 3.2 The Model
- 3.3 Assumptions
- 3.4 Modelling LSYPE Data
- 3.5 Model 1: Ordinal Explanatory Variables
- 3.6 Model 2: Dichotomous Explanatory Variables
- 3.7 Model 3: Nominal Variables
- 3.8 Predicting Scores
- 3.9 Model 4: Refining the Model
- 3.10 Comparing Coefficients
- 3.11 Model 5: Interaction Effects 1
- 3.12 Model 6: Interaction Effects 2
- 3.13 Model 7: Value Added Model
- 3.14 Diagnostics and Assumptions
- 3.15 Reporting Results
- Quiz
- Exercise
- Mod 3 - Multiple Reg
Using Statistical Regression Methods in Education Research

3.15 Reporting your Results
|
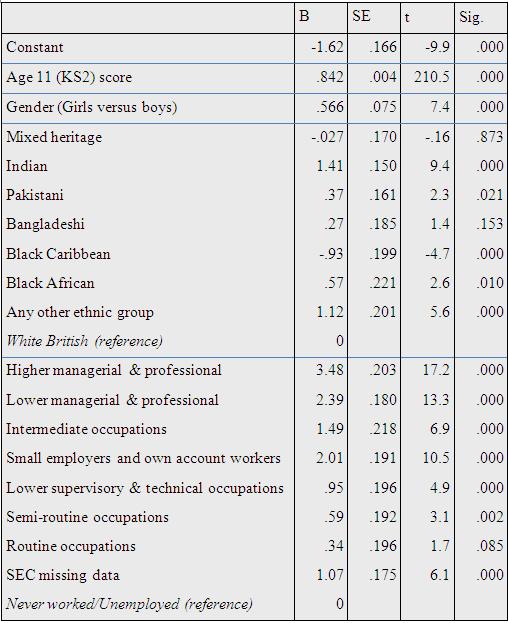
As we said before, you should check the style guide for your university or target audience before writing up and avoid cutting and pasting SPSS output into your report! That said, we could report our multiple regression in the following way: A multiple linear regression was carried out to ascertain the extent to which age 11 test scores, socio-economic class, gender and ethnicity can predict age 14 test scores. The regression model predicted 79.7% of the variance. The model was suitable for predicting the outcome (F = 3198.1, df = 17, p < .000). The coefficients for the explanatory variables are tabulated below:
Age 11 score was the strongest predictor of age 14 score. However gender, ethnicity and socio-economic class still accounted for a statistically significant amount of the variance. Students from higher managerial and professional homes obtained on average a score 3.5 points higher than the lowest social class (long-term unemployed) even when prior attainment at age 11, gender and ethnicity were controlled. In relation to ethnicity, Black Caribbean students scored approximately 1.0 point lower at age 14, and Indian students scored 1.4 points higher, than White British students. Both results were highly statistically significant (p<.000). Gender differences were also statistically significant with girls scoring 0.6 of a mark higher than boys, again after control for prior attainment, ethnicity and social class.
We think you should take our Quiz and work through our Exercises before moving on to the next module: Logistic Regression. Go on – it will be FUN! Well, sort of... |