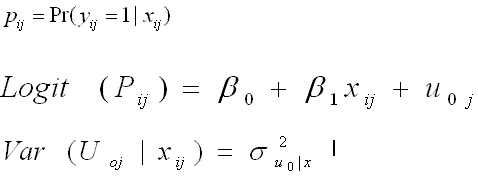
We can extend model 2 to include an explanatory variable,  . In this example,
let
us assume that this variable is the age in years of person i in area j.
  is now the probability of person i in
country j voting in the most recent election in their country, given that we know their age (denoted
as
 ). Nb: the mathematical operator |
means 'given'
or equivalently 'conditional on'.
The log odds of person i in area j turning out to vote,  , can now be expressed
as
a straight line, with intercept
  and slope
(gradient)
  . These are the two
coefficients
of the 'overall relationship' between the chance of someone voting and their age.
 is a term which determines the change
in
the intercept for country j compared with the overall intercept. If
  is
positive the intercept for the estimated linear relationship for country j is higher than the
overall
intercept. This would be the case for countries where there was a higher level of voting than
generally
in Europe, such as in Norway. If
  is
negative
the intercept for the estimated linear relationship for country j is lower than the overall
intercept.
This would be the case for countries where there was a lower level of voting than generally in
Europe,
such as in Poland. If
  is zero the
intercept
for the estimated linear relationship for country j is the same as the overall intercept.
The estimated value of
  does not change
from
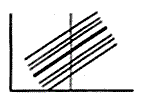
country to country; hence the lines are parallel as shown in the graph below. Because there is a
different intercept for each country this model is sometimes referred to as the 'model with
varying intercepts'. The estimated value of
  shows the extent of
variation in the intercepts, given that we know each person's age.

Graphical representation


