About this Resource

This is a worked example using the ESS Round 2 data to produce a table showing the distribution of key characteristics for a selection of countries of interest with and without weights for attitudes to the statement "Citizens should not cheat on their taxes". You will need to go online to follow this activity and register with ESS.

  1. Go to ESS in Nesstar. Six datasets are available in left hand panel, ESS Rounds 1 to 6. Please note these exercises use ESS Round 2 data, not the most recent round.
  2. Click on ESS2- 2004, ed. 3.3
  3. Expand variable description > Economic morality > Citizens should not cheat on taxes
  4. In right hand panel, click on Tabulation tab
  5. Left hand panel click on the Citizens should not cheat on their taxes variable and select Add to column to tabulate
  6. You will be prompted to login if you haven't already done so
  7. In left hand panel expand variable country Country (right click Add to row)
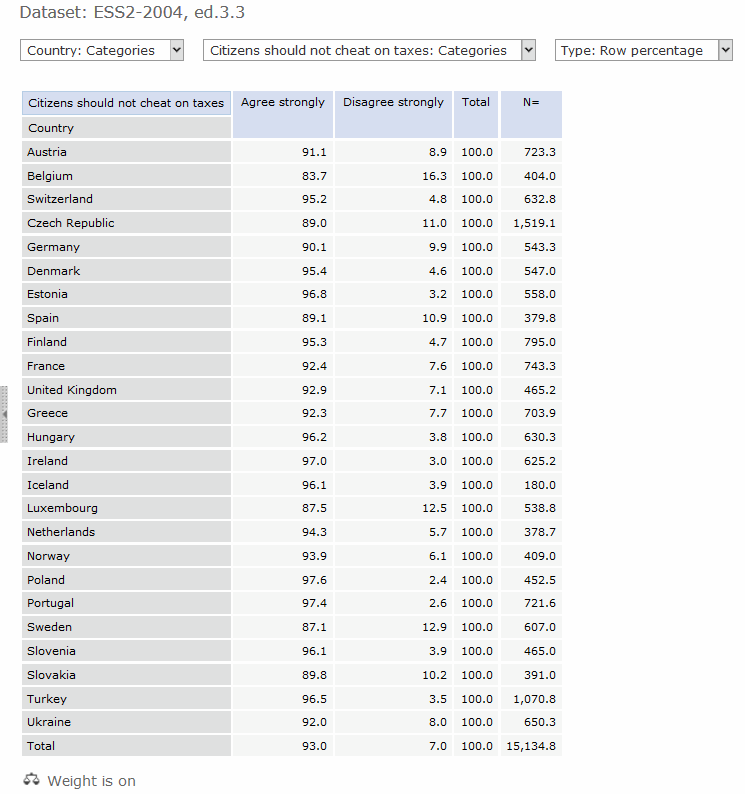
  8. This will produce a table with the countries down the left-hand stub and the responses to the questions across the top. The default for percentage calculation is column percent. In this instance we want row percent.

  9. Click on the third dropdown menu in the right hand panel change Type to row percent.
  10. This produces a table showing the distribution of the variable for each country on unweighted data. The N in the right hand column is the number of cases in each country. Comparisons made using this table would be invalid.

  11. To weight the data click on the balance icon. In the left hand box click on design weight so that it is highlighted, select by clicking the > so that it appears in the right hand box, then click OK.

    ESS Data screenshot

    Generating a table with ESS Data

  12. You can also limit the number of categories displayed using the drop down menu for the variable, selecting Choose categories and ticking which categories you want to include, for example, Agree strongly and agree and click Update, or choosing a smaller number of countries. The table now is more readable but pay attention to how the percentages are calculated.

The University of Manchester; Mimas; ESRC; RDI

Countries and Citizens: Unit 3 Making cross-national comparisons using micro data by Siobhan Carey, Department for International Development is licensed under a Creative Commons Attribution-Non-Commercial-Share Alike 2.0 UK: England & Wales Licence.