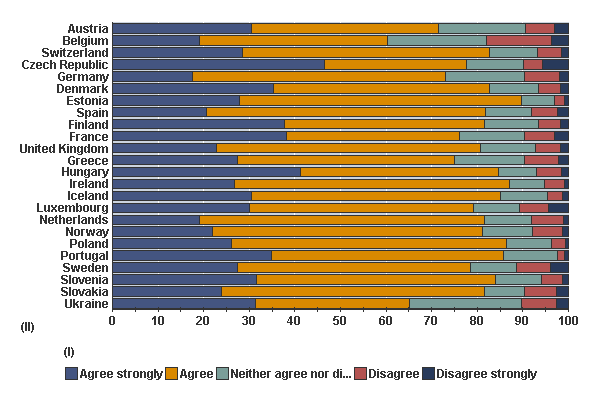
Your chart with weights on should look something like this.

Comment on graphs: In this example both Belgium and the Ukraine have lower proportions who support the statement about paying taxes. Looking at the corollary however, it is clear that Ukraine is not so different from other countries. Both Belgium and the Ukraine had higher proportions of respondents who said they neither agreed nor disagreed.